The Terrible Cost of Sanctuary Cities
Hubert Collins, American Renaissance, March 15, 2020
The Office of the Inspector General recently audited Immigration and Customs Enforcement (ICE), and the conclusions are a damning picture of “sanctuary cities.”
When a criminal alien is about to be released from prison, and ICE wants to detain or deport him, the prison gets a “detainer.” This means the alien is supposed to beheld for up to 48 hours so ICE can pick him up.
The audit notes that between October 1, 2013 and September 30, 2019, ICE nabbed 195,500 criminal aliens from Federal and state prisons, and another 321,400 from local jails. Together, those two numbers were 79 percent of all the arrests it made during that time. Detainers are an essential part of ICE’s work.
Sanctuary cities, which the audit refers to euphemistically as “uncooperative jurisdictions,” ignore detainers and let criminal aliens go. This means ICE has to make arrests in the community, which is much harder — and much more dangerous — than picking them up from prison or jail.
The audit describes three incidents in which “sanctuary cities” ignored an ICE detainer and released an illegal immigrant who went on to commit a violent crime. They could and should have listed dozens. ICE keeps track and the data are publicly available.
In January, ICE announced that Cook County (i.e. Chicago) ignored over 1,000 detainers in Fiscal Year 2019. The same month, in New York City, an illegal South American was arrested for sexually abusing and murdering a 92-year old woman. Two months earlier, he had been released because the local police ignored the ICE detainer on him. There are hundreds of similarly gruesome stories — search for “detainer” on AmRen and you can find many of them.
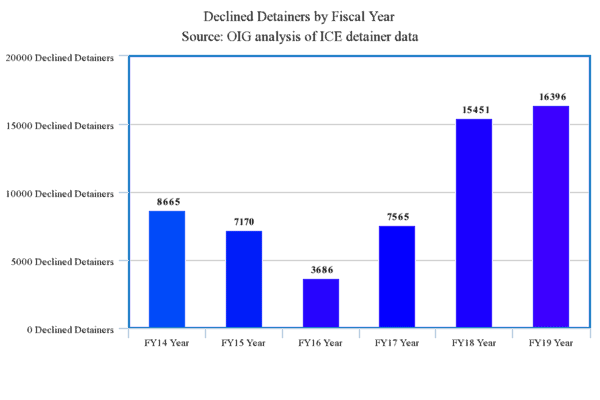
The audit summarizes the data: “ICE-issued detainers increased from 137,000 in FY 2014 to 165,500 in FY 18,000 2019 — an increase of 20 percent. In the same time period, the number of detainers law enforcement agencies declined to honor also increased from 8,665 to 16,400, or an 89 percent increase.” Here is a graph of ignored detainers:
ICE still manages to catch an awful lot of the criminal aliens turned loose by “sanctuaries.” Of the nearly 59,000 that went on the lam between October 1, 2013 and September 30, 2019, ICE arrested about 70 percent. But that meant that of September 30, 2019, the remaining 17,700 were still on the prowl, and there is no telling what crimes they will commit.
Surely, even the most crazed “sanctuary” jurisdictions will eventually realize that deporting foreign criminals is better than keeping them as neighbors.
This is a table from the audit that breaks down the charges and convictions for everyone arrested by ICE during Fiscal Year 2019.
| Violation Category | Charges | Convictions | Total |
|---|---|---|---|
| Traffic Offenses – DUI | 25,417 | 49,106 | 74,523 |
| Traffic Offenses | 28,519 | 39,717 | 68,236 |
| Dangerous Drugs | 20,277 | 39,717 | 67,730 |
| Immigration | 10,769 | 46,888 | 57,657 |
| Assault | 19,648 | 26,156 | 45,804 |
| Obstructing Judiciary, Etc. | 10,442 | 10,287 | 20,729 |
| General Crimes | 8,114 | 9,891 | 18,005 |
| Larceny | 4,599 | 12,456 | 17,055 |
| Obstructing the Police | 5,641 | 8,776 | 14,417 |
| Fraudulent Activities | 4,145 | 7,875 | 12,020 |
| Burglary | 2,565 | 7,757 | 10,322 |
| Weapon Offenses | 3,281 | 6,997 | 10,278 |
| Public Peace | 3,605 | 5,838 | 9,443 |
| Sex Offenses | 1,992 | 4,658 | 6,650 |
| Invasion of Privacy | 2,078 | 4,233 | 6,311 |
| Family Offenses | 2,296 | 3,139 | 5,435 |
| Stolen Vehicle | 1,568 | 3,686 | 5,254 |
| Sexual Assault | 1,654 | 3,407 | 5,061 |
| Robbery | 1,155 | 3,581 | 4,736 |
| Forgery | 1,549 | 2,979 | 4,528 |
| Damaged Property | 1,653 | 2,245 | 3,898 |
| Liquor | 1,991 | 1,799 | 3,790 |
| Stolen Property | 1,181 | 2,562 | 3,743 |
| Flight / Escape | 1,171 | 2,012 | 3,183 |
| Homicide | 374 | 1,549 | 1,923 |
| Kidnapping | 723 | 1,110 | 1,833 |
| Health / Safety | 481 | 1,012 | 1,493 |
| Commercialized Sex Offenses | 605 | 743 | 1,348 |
| Threats | 534 | 658 | 1,192 |
| Other Crimes | 876 | 1,590 | 2,466 |
| TOTAL | 168,903 | 320,160 | 489,063 |