Race and Crime in America
Jared Taylor, American Renaissance, June 1994
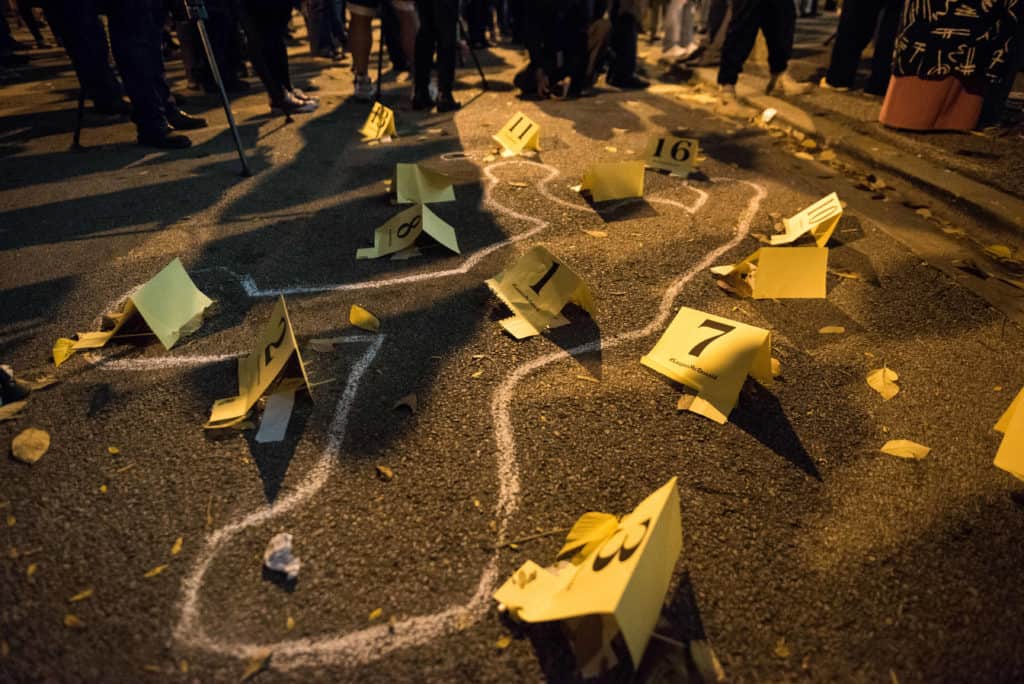
Credit Image: © Max Herman / NurPhoto via ZUMA Press
It is no better than a cliché to point out that there is a great deal of violent crime in the United States. Americans commit more than 20,000 murders, 100,000 rapes, 650,000 robberies and 1,000,000 aggravated assaults every year. But what do those numbers mean? Are they going up — as everyone assumes — or are they declining? How much crime do blacks commit, and how much of their violence is directed against whites?
Every year, the U.S. Department of Justice issues two fat volumes of crime statistics that contain most of the information needed to answer these questions. The more useful of the two is the Sourcebook of Criminal Justice Statistics, but the FBI’s Uniform Crime Reports is also illuminating. As one would expect, these books do not always give racial data and they almost never make explicit racial comparisons. However, our government does collect enough information to allow a researcher to make most of the relevant racial comparisons for himself.
Some of the most important findings come from surveys of crime victims. Every year the Justice Department interviews the members of 40,000 to 50,000 households and asks detailed questions about all crimes of which they were victims. Since police departments often file reports only on people they have arrested, this survey gathers information about two other important crime categories: those that do not lead to an arrest and those not reported to the police. Survey participants are always asked the race of the perpetrator, so the results of this survey are an accurate assessment both of real crime levels in America and of who the criminals are, even if they are never caught.
The only really inexcusable failing in federal statistics is that they almost always include Hispanics in the “white” category rather than break them out separately. Hispanics, now about nine percent of the population, are not so violent as blacks but they are markedly more violent than whites. By calling them “white,” the Department of Justice exaggerates white crime rates.
Despite this, the contrast between black and “white” crime rates is staggering — and virtually unknown. Many of the figures in this article must be derived from Department of Justice statistics, and journalists almost never do this.
Murder and Robbery
In 1992, police reported 23,760 murders and non-negligent homicides. Although they are only 12 percent of the population, blacks committed about 55 percent of the murders. This means that murder rates, by race, were dramatically different. “Whites” (including Hispanics) killed at a rate of 5.1 per 100,000 while the rate for blacks was 43.3 per 100,000. Blacks are therefore 8.5 times more likely to commit murder than whites and, all by themselves, account for the fact that the United States has a higher murder rate than England or Italy.
Most of the time, blacks killed other blacks, but about 13 percent of their victims were white. Whites also usually killed each other, but six percent of their victims were black. In all, there were 2.7 times as many whites killed by blacks as blacks killed by whites, which means that any given black is 17 times more likely to kill a white than vice versa.

Credit Image: Mark Allen Johnson / ZUMAPRESS.com
Robbery, or “mugging,” is the street crime that people fear most, and in 1992, 672,478 robberies were reported to the police. Victimization studies show that only about 60 percent of the victims of a successful robbery report the crime to the police, so the real figure was well over one million — one for every 250 people every year. Robbery is very much a black specialty, and blacks committed over 60 percent of the year’s robberies. This means that blacks committed robbery at a rate of 1,343 per 100,000 while the white rate was 126 per 100,000 — less than one tenth the black rate. When it comes to gang robbery — perhaps the quintessentially black crime — blacks are 22 times more likely than whites to be offenders.
Unlike murder, robbery is not a crime that blacks mainly practice on each other. Over half of the robberies by blacks are of whites (including Hispanics). White muggers (including Hispanics) choose blacks as their victims only about four percent of the time and steal from other whites the rest of the time. Put differently, for every black robbed by a white, there are 24 whites robbed by a black.
Similar disproportions are found for the other crimes of violence — rape and aggravated assault (assault with the intent of inflicting severe injury, usually with a deadly weapon). When blacks commit violent crime they choose white victims just over half the time, whereas when whites commit violent crimes they target blacks about two percent of the time. Thus, any given black is 70 times more likely to commit criminal violence against a white than is any given white likely to commit criminal violence against a black.
For gang violence the odds are even steeper. Fifty-six percent of black gang robberies, rapes, and assaults are committed against whites, while only 4.5 percent of all white gang violence is committed against blacks. Any given black is therefore 83 times more likely to take part in gang violence against whites than vice versa. These disproportions are based on surveys of crime victims — not arrest records — so they reflect the most reliable information available on inter-racial violence. They are almost never reported.
These facts do not sit well with the currently fashionable notion that the victims of black crime are mostly other blacks. There is actually more “black-on-white” than “black-on-black” criminal violence, though one would search the mainstream press in vain for this fact. Black-on-black crime is the subject of conferences and earnest analysis; black-on-white crime has scarcely any official recognition.
As noted above, the one crime that blacks generally do keep within the “community” is murder. This accounts for why blacks are seven times more likely to be murdered than whites. However, when it comes to the less serious but far more common crimes of robbery, rape, and assault, the racial gap in victimization rates is much narrower. Despite the fact that blacks are 800 to 2,000 percent more likely than whites to commit crimes of violence, they are only 50 percent more likely to be victims of violent crime. The difference is due to the fact that blacks vent so much of their violence upon people of other races.
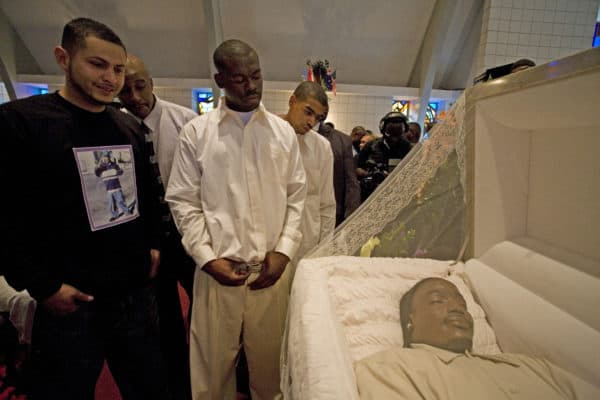
A Gang Funeral for Brandon B.L Bullard a well respected Grape Street Crip. During the funeral a fight broke out causing panic sending funeral goers running and screaming for their lives. (Credit Image: Mark Allen Johnson / ZUMAPRESS.com)
One interesting statistic reported by the Department of Justice is the number of drug-related admissions to hospital emergency rooms. Blacks are three times more likely than whites to be involved in such admissions, and 12 times more likely to be admitted because of cocaine. Interestingly, blacks are under-represented in emergency-room admissions for use of tranquilizers and sedatives. These are often the result of overdose suicide attempts, and since whites are twice as likely as blacks to commit suicide, such admissions are overwhelmingly white.
The Prison Population
Prison statistics are virtually the only ones for which the federal government reports Hispanics as a separate category, and the results are revealing. Whites, who are still about 75 percent of the population (though this includes North Africans, Arabs and Persians), made up only 38.7 percent of the nation’s prison population in 1989, and the percentage has been decreasing. Forty one percent of all inmates were black, and 17.5 percent were Hispanic. This means that blacks were 6.7 times more likely than whites to be in jail and Hispanics were 3.4 times more likely.
Disproportions like these are often dismissed as the result of “racist” police work, but the most plausible explanation is that non-whites are more likely to be in jail because they commit more crime. In passing, it is worth noting that people are right to assume that most criminals are poorly educated: 54 percent are high school dropouts.
The assumption that all prisons are crowded is correct only for some states — generally those that have had rapidly increasing populations. California’s prisons operate at 135 percent of capacity and those in New Jersey are at 146 percent. However, only 15 states are running at over 100 percent. Alaska operates at 35 percent, Wyoming at 51 percent, Montana at 52 percent, and North Dakota at 38 percent.
The death sentence gets a great deal of attention because blacks are said to be more likely to get it than whites. That is not true. In April 1993, 50.6 percent of death row inmates were white, 39 percent were black, and seven percent Hispanic. Since 1977, when the death penalty was resumed after a 10-year break, the only crime for which it has been given is murder. Since blacks commit more than half the nation’s murders, they are considerably underrepresented on death row. The same is true for actual executions. Of the 147 people executed since 1977, 43 percent have been black.
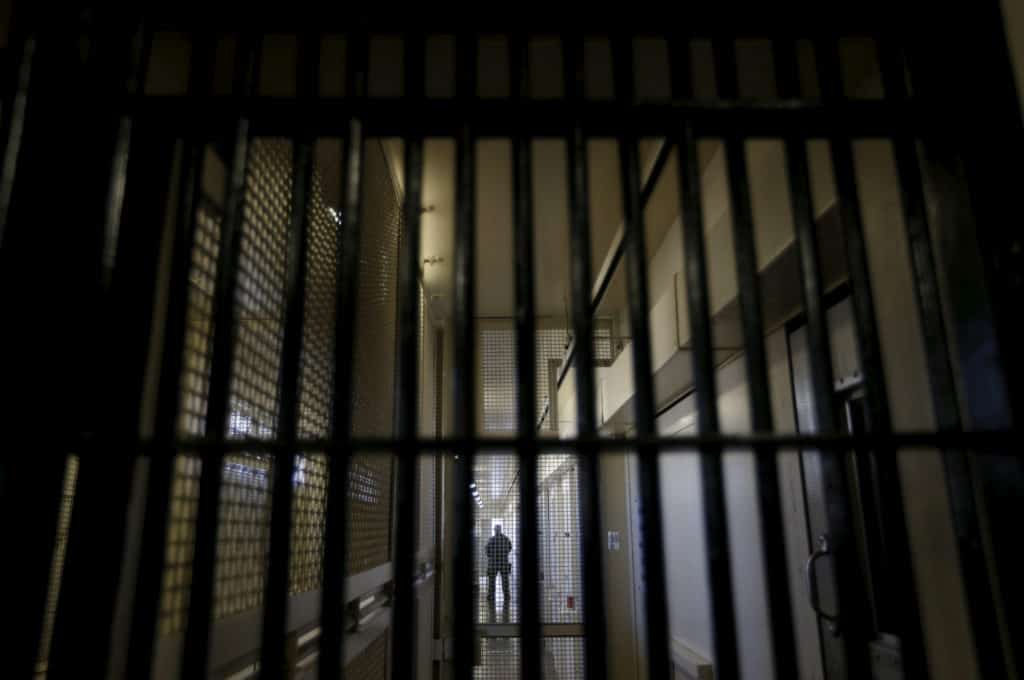
(Credit Image: © Stephen Lam/Reuters via ZUMA Press)
Congress has been toying with laws that would require states to execute criminals by racial quota. If the quotas were based on the number of murderers, rather than on percentages of the population, executions of blacks would have to be stepped up. It is just as well no one is urging that the death penalty be given equally to men and women; for every woman on death row there are 70 men.
Historical Trends
Crime is a serious problem, and getting worse. However, not all crimes are increasing at the same rate. The murder rate has essentially been flat for 20 years (see first chart). Though preliminary reports indicate a slight upturn in 1993, there were actually almost 1,000 fewer murders in 1992 than in the previous year. It is true that the 1992 total of 23,760 is far higher than the 8,530 murders in 1962, but much of the rise is due to increases in population. The national murder rate — the number of killings per 100,000 Americans — has risen from 4.6 in 1962 to only 9.3 in 1992. Americans are therefore twice as likely to kill each other as they were 30 years ago, but this is a modest increase compared to the rise in other violent crimes.
For murder, 1962 was something like the end of an era. The rate per 100,000 had bobbed along between four and five during most of the 1940s and 1950s (it was an uncharacteristically high 5.8 in 1938), but first went above 9.0 in 1972. Since then, aside from a high of 10.2 in 1980, the rate has stayed between 7.9 and 9.8. The United States is not therefore, suffering from a shocking and unprecedented plague of murders. Murder rates nearly doubled from 1962 to 1972, but have held steady for the last 20 years.
Rape shows a very different pattern. In the 1930s, rape was considered a more serious offense than it is today, and could well get a man the death penalty. As sexual mores changed and rape ceased to merit execution, rape rates soared. The last execution for rape was in 1964, and the rate has increased about 450 percent since 1962.
In 1992, aggravated assault rates were at an all-time record of 441.8 per 100,000. This number has been climbing steadily since 1962, when the figure was 88.6, or about one fifth the current rate. Overall violent crime rates show a similar increase. It is important to bear in mind that these are crime rates, not raw numbers, and the upward slope of these lines reflects an increasingly crime-prone society, not a larger population.
It is commonly claimed by liberals that more prisons and longer prison terms do not prevent crime. The argument is based on the fact that although we have been putting more and more people in jail (see third chart), crime rates have not fallen. The obvious rejoinder is that rapists and muggers who are in jail cannot possibly rape and mug, and that if they were on the streets our crime rates would be even higher.
During the 1960s, the very decade when crime rates began to soar, the rate of incarceration fell. Liberal social policies combined with lenient sentencing produced exactly what one would expect: a crime wave. America quickly got over its love affair with felons and, in the 1970s and 1980s, started locking up criminals at record rates.
This almost certainly explains why the increase in some crime rates has slowed. Immigration, both legal and illegal, brings in disproportionate numbers of criminals. Likewise, the number of welfare-bred degenerates continues to increase. Until this changes, there is no reason to expect crime rates to go down except through increased incarceration rates.
Of course, incarceration works only when criminals are caught, and American policemen are less able to catch them than before. The bar chart on this page compares the rates at which crimes were cleared by an arrest in 1953 with clearance rates in 1992. They have declined in all categories while, at the same time, increasing numbers of crimes do not even go reported. The chances of a crime going unpunished are thus very high.
Race and Crime
Crime rates have risen for all races, but has black violence grown more or less rapidly than white violence? It is not easy to find out, since the federal government has not always kept crime records in the same manner. In the 1930s and 1940s, for example, the Department of Justice categorized criminals as White, Negro, [American] Indian, Chinese, Japanese, Mexican, and Other, which was considerably more realistic than the current categories of Black, White, and Other.
Also, until 1940, the government calculated arrest rates by race, though only for Native White, Foreign-Born White, and Negro. (Compared to native whites, foreign-born whites consistently had lower arrest rates — sometimes dramatically so. This may reflect the fact that young men commit most of the crime, and some foreign-born whites came to America after they had outgrown their most crime-prone years.) It would be interesting to know why the department stopped publishing these figures.
It is possible to compare differential arrest rates by race for 1940 and 1992, though the data may not have been collected the same way in both years and may not be equivalent. The table to the right shows how much more likely blacks were than whites to be arrested for crimes of violence. In 1940, a black was four times more likely than a white to be arrested for robbery, but in 1992, he was 11 times more likely. Multiples for robbery and rape have more than doubled, but the gap for assault has narrowed. Whether or not these data are strictly comparable, they show that blacks have been, and continue to be, much more violent than whites.
Although our nation is reluctant to admit it, crime is clearly a racial problem. The best single predictor of a city or neighborhood’s crime rate is its racial composition. Since blacks commit violent crimes at about ten times the white rate, if a city’s population changes from all-white to half-white/half-black, the violence rate can be expected to go up fivefold. All-black areas are likely to have about ten times as much violent crime as all-white ones.
For this reason alone, whites are justified in avoiding black neighborhoods and in not wanting blacks to move into their neighborhoods. Of course, crime is not the only result when neighborhoods become black. Schools decline, housing decays, stores close, vandalism increases, and all the familiar signs of ghetto squalor begin to appear.
It is probably not possible to bring black crime rates down to the white level. So long as blacks and whites continue to live together, whites will pay the high price of sharing their society with an inveterately violent racial minority.
[Editor’s Note: For more recent statistics on race and crime in America, go to the American Renaissance “Reports” page here.]