The U.S. Department of Agriculture’s Economic Research Service (ERS) is out with a report on what might be called the “recalls gone wild” era.
In a 31-page report “Trends in Food Recalls, 2004-13” the researchers parse data from the Food and Drug Administration and USDA’s Food Safety and Inspection Service (FSIS).
The facts showed an increase of almost 125 percent in the average number of food recalls when comparing data from 2004-2013. The annual average number of food recalls from 2004-2008 was 304. From 2009 to 2013 the average annual number was 676.
“While an increase in the volume of food sold in the United States during this decade partially explains this statistically significant increase, other factors are also likely at play,” writes report author Elina Tselepidakis Page.
“For example, pathogen and risk detection technology substantially improved, regulatory oversight and enforcement increased, and Congress passed two major food policy laws, the Food Allergen Labeling and Consumer Protection Act (FALCPA) and the FDA Food Safety Modernization Act (FSMA).”
A total of 4,900 recalls occurred during the decade with 86.8 percent being FDA recalls and 13.2 percent falling under FSIS jurisdiction.
The ERS report says three outlier events during 2009 and 2010 also caused spikes in the data. The most significant involved 400 separate recalls connected to the nationwide Salmonella outbreak associated with the now-defunct Peanut Corporation of America.
Also in 2009 there were more than 100 separate recalls of Salmonella-tainted pistachio products.
And finally a year later, there were about 80 recalls of spice blends, soups, sauces, gravies, and dressings stemming from Salmonella contaminated hydrolyzed vegetable protein (HPV).
In order from highest t0 lowest, the top 10 food categories in terms of the number of recalls from 2004-2013 were:
- prepared foods and meals, excluding soups;
- nuts, seeds, and nut products;
- baked goods;
- grains and grain products;
- candy products;
- sauces, condiments, and dressings;
- fish and fish products;
- beverages;
- dairy-based desserts; and
- fruit and fruit products, excluding juice.
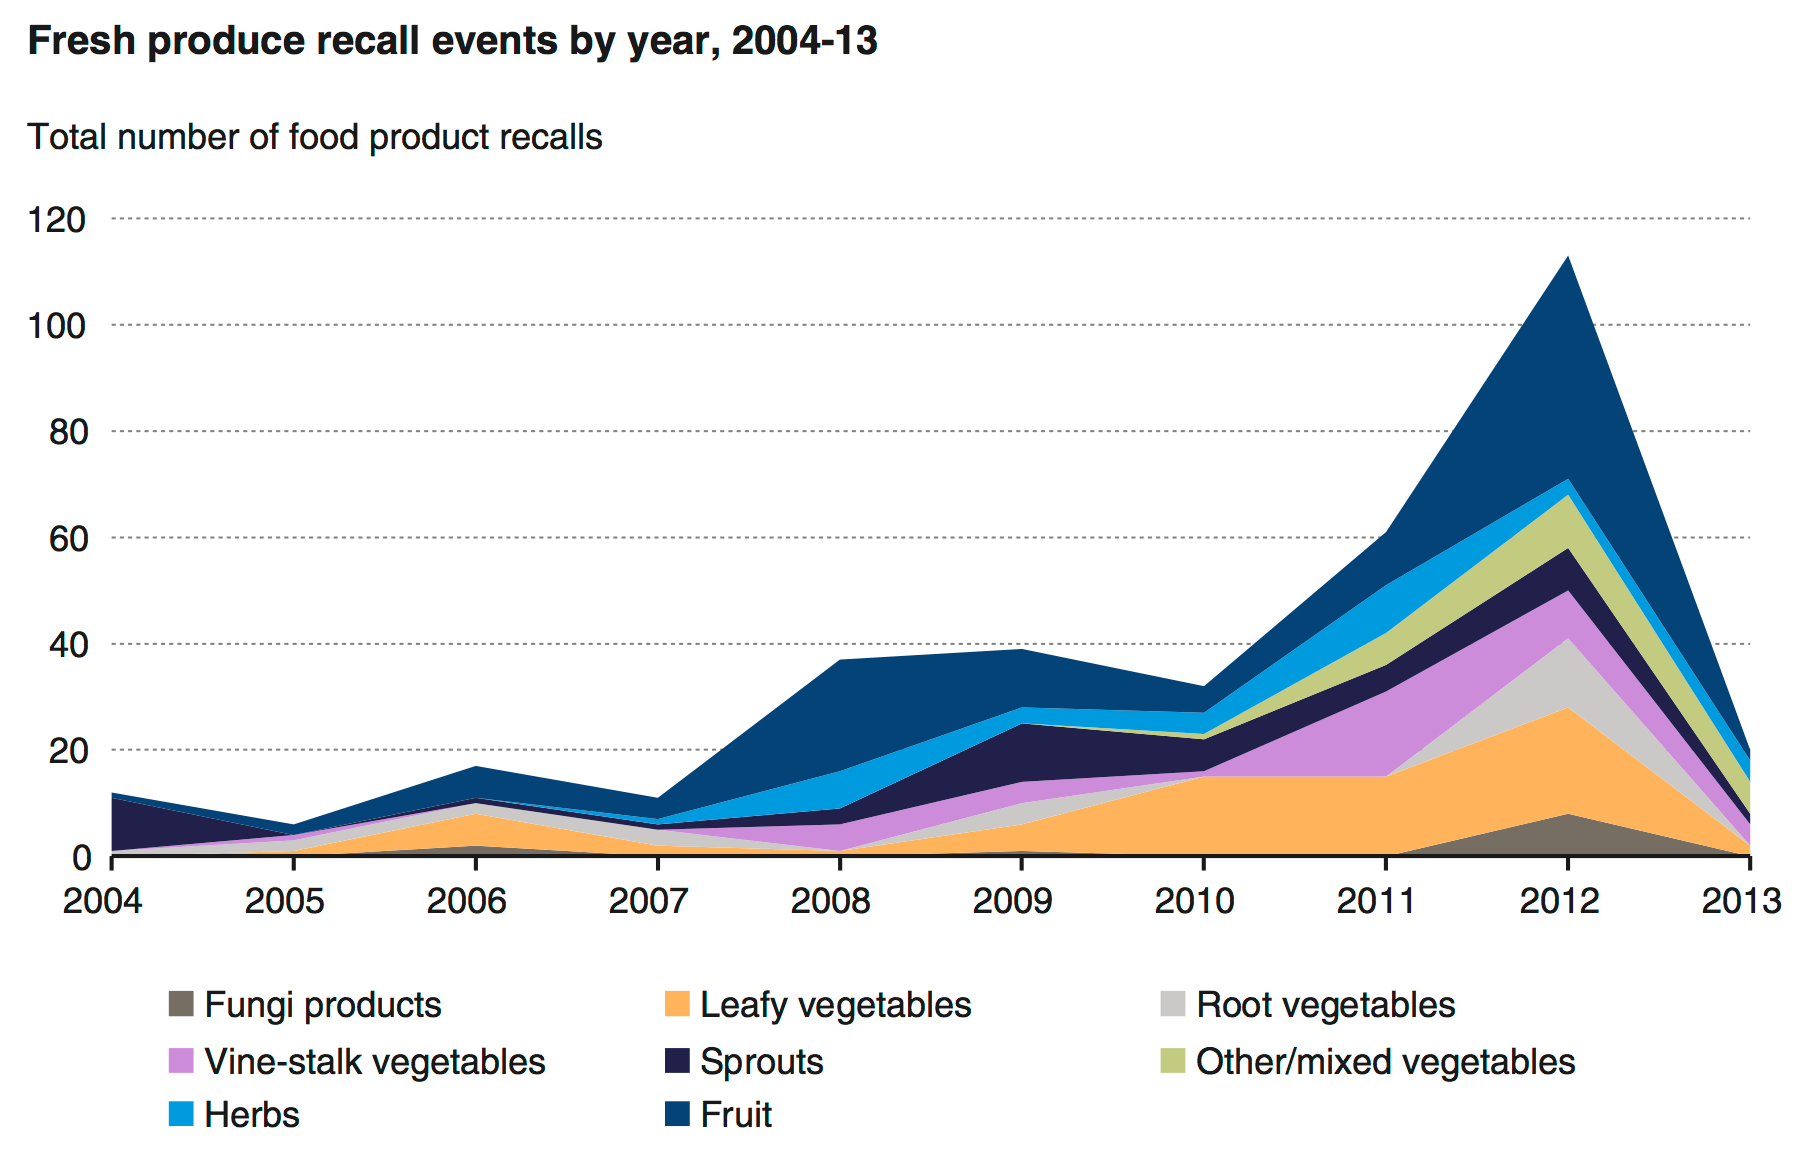
But numbers are not enough when it comes to food safety. “Fresh produce and meat/poultry/seafood recalls are of particular interest as these foods represent the greatest potential health risk in terms of food safety,” according to the report. “In fact, produce and meat-poultry commodities accounted for the majority of foodborne illnesses, hospitalizations, and deaths between 1998 and 2008.
“The total number of fresh produce recalls increased steadily throughout the decade, spiking in 2012 following two major Salmonella outbreaks linked to domestic cantaloupes and imported mangoes, before dramatically decreasing in 2013.”
The top five reasons for recalls were: undeclared allergens at 27.41 percent; Salmonella at 26.69 percent; Listeria monocytogenes at 10.24 percent; undeclared substances at 9.80 percent; and Extraneous material 5.22 percent.
Shiga-toxin-producing E. coli was responsible for 149 recalls or 3.04 percent during the 10 year period, and other pathogens for 60 additional recalls or 1.22 percent,
“Food product recall events increased by an average of 20 events a year from 2004 through 2013,” the report concludes. “However, this upward trend should not be interpreted to mean that foods are becoming riskier. Rather, an increasingly complex food supply system, technology improvements in health risk detection, increased regulatory oversight and enforcement, and the passing of two major food policy laws (FALCPA and FSMA) may have contributed to the significant rise in food recalls.”
(To sign up for a free subscription to Food Safety News, click