Showing posts sorted by relevance for query ssgac. Sort by date Show all posts

Friday, May 13, 2016

Flipping DNA switches


The recently published SSGAC study (Nature News) found 74 genome-wide significant hits related to educational attainment, using a discovery sample of ~300k individuals. The UK Biobank sample of ~110k individuals was used as a replication check of the results. If both samples are combined as a discovery sample 162 SNPs are identified at genome-wide significance. These SNPs are likely tagging causal variants that have some effect on cognitive ability.

The SNP hits discovered are common variants -- both (+) and (-) versions are found throughout the general population, neither being very rare. This means that a typical individual could carry 80 or so (-) variants. (A more precise estimate can be obtained using the minor allele frequencies of each SNP.)

Imagine that we knew the actual causal genetic variants that are tagged by the discovered SNPs (we don't, yet), and imagine that we could edit the (-) version to a (+) version (e.g., using CRISPR; note I'm not claiming this is easy to do -- it's a gedanken experiment). How much would the IQ of the edited individual increase? Estimated effect sizes for these SNPs are uncertain, but could be in the range of 1/4 or 1/10 of an IQ point. Multiplying by ~80 gives as a crude estimate of perhaps 10 or 15 IQ points up for grabs, just from the SSGAC hits alone.

Critics of the study point out that only a small fraction of the expected total genetic variance in cognitive ability is accounted for by SSGAC SNPs. But the estimate above shows that the potential biological effect of these SNPs, taken in aggregate, is not small! Indeed, once many more causal variants are known (eventually, perhaps thousands in total), an unimaginably large enhancement of human cognitive ability might be possible.

See also
Super-intelligent humans are coming
On the genetic architecture of intelligence and other quantitative traits

(Super-secret coded message for high g readers: N >> sqrt(N), so lots of SDs are up for grabs! ;-)

Wednesday, June 10, 2015

More GWAS hits on cognitive ability: ESHG 2015


This is a talk from ESHG 2015, which just happened in Glasgow. The abstract is old; at the talk the author reportedly described something like 70 genome wide significant hits (from an even larger combined sample) which are most likely associated with cognitive ability. This is SSGAC ... stay tuned!
Title: C15.1 - Genome-wide association study of 200,000 individuals identifies 18 genome-wide significant loci and provides biological insight into human cognitive function

Keywords: Educational attainment; genome-wide association; cognitive function

Authors: T. Esko1,2,3, on the behalf of Social Science Genetic Association Consortium (SSGAC); 1Estonian Genome Center, University of Tartu, Tartu, Estonia, 2Boston Children’s Hospital, Boston, MA, United States, 3Broad Institute of Harvard and MIT, Cambridge, MA, United States.

Abstract: Educational attainment, measured as years of schooling, is commonly used as a proxy for cognitive function. A recent genome wide association study (GWAS) of educational attainment conducted in a discovery sample of 100,000 individuals identified and replicated three genome-wide significant loci. Here, we report preliminary results based on conducted in 200,000 individuals. We replicate the previous three loci and report 15 novel, genome-wide significant loci for educational attainment. A polygenic score composed of 18 single nucleotide polymorphisms, one from each locus, explains ~0.4% of the variance educational attainment. Applying data-driven computational tools, we find that genes in loci that reach nominal significance (P < 5.0x10⁻⁵) strongly enrich for 11 groups of biological pathways (false discovery rates < 0.05) mostly related to the central nervous system, including dendritic spine morphogenesis (P=1.2x10⁻⁷), axon guidance (P=5.8x10⁻⁶) and synapse organization (P=1.7x10⁻⁵), and show enriched expression in various brain areas, including hippocampus, limbic system, cerebral and entorhinal cortex. We also prioritized genes in associated loci and found that several are known to harbor genes related to intellectual disability (SMARCA2, MAPT), obesity (RBFOX3, SLITRK5), and schizophrenia (GRIN2A) among others. By pointing at specific genes, pathways and brain areas, our work provides novel biological insights into several facets of human cognitive function.

Sunday, December 04, 2016

Genomic Prediction of Cognitive Ability: Dunedin Study

A quiet revolution has begun. We now know enough about the genetic architecture of human intelligence to make predictions based on DNA alone. While it is a well-established scientific fact that variations in human cognitive ability are influenced by genes, many have doubted whether scientists would someday decipher the genetic code sufficiently to be able to identify individuals with above or below average intelligence using only their genotypes. That day is nearly upon us.

The figures below are taken from a recently published paper (see bottom), which examined genomic prediction on a longitudinal cohort of ~1000 individuals of European ancestry, followed from childhood into adulthood. (The study, based in Dunedin, New Zealand, extends over 40 years.) The genomic predictor (or polygenic score) was constructed using SSGAC GWAS analysis of a sample of more than one hundred thousand individuals. (Already, significantly more powerful predictors are available, based on much larger sample size.) In machine learning terminology, the training set includes over a hundred thousand individuals, and the validation set roughly one thousand.


These graphs show that individuals with higher polygenic score exhibit, on average, higher IQ scores than individuals with lower polygenic scores.


This figure shows that polygenic scores predict adult outcomes even when analyses account for social-class origins. Each dot represents ten individuals.


From an earlier post, Genomic Prediction of Adult Life Outcomes:
Genomic prediction of adult life outcomes using SNP genotypes is very close to a reality. This was discussed in an earlier post The Tipping Point. The previous post, Prenatal and pre-implantation genetic diagnosis (Nature Reviews Genetics), describes how genotyping informs the Embryo Selection Problem which arises in In Vitro Fertilization (IVF).

The Adult-Attainment factor in the figure above is computed using inputs such as occupational prestige, income, assets, social welfare benefit use, etc. See Supplement, p.3. The polygenic score is computed using estimated SNP effect sizes from the SSGAC GWAS on educational attainment (i.e., a simple linear model).

A genetic test revealing that a specific embryo is, say, a -2 or -3 SD outlier on the polygenic score would probably give many parents pause, in light of the results in the figure above. The accuracy of this kind of predictor will grow with GWAS sample size in coming years.

Via Professor James Thompson. See also discussion by Stuart Ritchie.
The Genetics of Success: How Single-Nucleotide Polymorphisms Associated With Educational Attainment Relate to Life-Course Development

Psychological Science 2016, Vol. 27(7) 957–972
DOI: 10.1177/0956797616643070

A previous genome-wide association study (GWAS) of more than 100,000 individuals identified molecular-genetic predictors of educational attainment. We undertook in-depth life-course investigation of the polygenic score derived from this GWAS using the four-decade Dunedin Study (N = 918). There were five main findings. First, polygenic scores predicted adult economic outcomes even after accounting for educational attainments. Second, genes and environments were correlated: Children with higher polygenic scores were born into better-off homes. Third, children’s polygenic scores predicted their adult outcomes even when analyses accounted for their social-class origins; social-mobility analysis showed that children with higher polygenic scores were more upwardly mobile than children with lower scores. Fourth, polygenic scores predicted behavior across the life course, from early acquisition of speech and reading skills through geographic mobility and mate choice and on to financial planning for retirement. Fifth, polygenic-score associations were mediated by psychological characteristics, including intelligence, self-control, and interpersonal skill. Effect sizes were small. Factors connecting DNA sequence with life outcomes may provide targets for interventions to promote population-wide positive development.

Friday, July 27, 2018

Insight Podcast: James Lee interview on SSGAC EA3


Spencer Wells and Razib Khan interview James Lee (Professor of Psychology, University of Minnesota, BA Berkeley, PhD Harvard) about the recent SSGAC EA3 GWAS.

Comment: James mentions that EA3 may be approaching the GCTA h2 limit (~0.15? so limiting r ~ 0.4) already. But the limit for actual cognitive ability is much higher; with enough data I think we could get to r ~ 0.6 or even r ~ 0.7 eventually for common SNPs -- similar to height.

United Club, HK International Airport


James, me, Chris Chang. (About $1M worth of Illumina HiSeqs in crates behind us?)


Monday, May 22, 2017

NYTimes: In ‘Enormous Success,’ Scientists Tie 52 Genes to Human Intelligence


The Nature Genetics paper below made a big splash in today's NYTimes: In ‘Enormous Success,’ Scientists Tie 52 Genes to Human Intelligence. The picture above is of a UK Biobank storage facility for blood (DNA) samples.

The results are not especially surprising to people who have been following the subject, but this is the largest sample of genomes and cognitive scores yet analyzed (~80k individuals). SSGAC has assembled a much larger dataset (~750k, soon to be over 1M; over 600 genome-wide significant SNP hits), but are working with a proxy phenotype for cognitive ability: years of education.
Genome-wide association meta-analysis of 78,308 individuals identifies new loci and genes influencing human intelligence

Nature Genetics (2017) doi:10.1038/ng.3869
Received 10 January 2017 Accepted 24 April 2017 Published online 22 May 2017

Intelligence is associated with important economic and health-related life outcomes1. Despite intelligence having substantial heritability2 (0.54) and a confirmed polygenic nature, initial genetic studies were mostly underpowered3, 4, 5. Here we report a meta-analysis for intelligence of 78,308 individuals. We identify 336 associated SNPs (METAL P < 5 × 10⁻⁸) in 18 genomic loci, of which 15 are new. Around half of the SNPs are located inside a gene, implicating 22 genes, of which 11 are new findings. Gene-based analyses identified an additional 30 genes (MAGMA P < 2.73 × 10⁻⁶), of which all but one had not been implicated previously. We show that the identified genes are predominantly expressed in brain tissue, and pathway analysis indicates the involvement of genes regulating cell development (MAGMA competitive P = 3.5 × 10⁻⁶). Despite the well-known difference in twin-based heratiblity2 for intelligence in childhood (0.45) and adulthood (0.80), we show substantial genetic correlation (rg = 0.89, LD score regression P = 5.4 × 10⁻²⁹). These findings provide new insight into the genetic architecture of intelligence.
Perhaps the most interesting aspect of this study is the further evidence it provides that many (the vast majority?) of the hits discovered by SSGAC are indeed correlated with cognitive ability (as opposed to other traits such as Conscientiousness, which might influence educational attainment without affecting intelligence):
To examine the robustness of the 336 SNPs and 47 genes that reached genome-wide significance in the primary analyses, we sought replication. Because there are no reasonably large GWAS for intelligence available and given the high genetic correlation with educational attainment, which has been used previously as a proxy for intelligence7, we used the summary statistics from the latest GWAS for educational attainment21 for proxy-replication (Online Methods). We first deleted overlapping samples, resulting in a sample of 196,931 individuals for educational attainment. Of the 336 top SNPs for intelligence, 306 were available for look-up in educational attainment, including 16 of the independent lead SNPs. We found that the effects of 305 of the 306 available SNPs in educational attainment were sign concordant between educational attainment and intelligence, as were the effects of all 16 independent lead SNPs (exact binomial P < 10−16; Supplementary Table 14). ...
Carl Zimmer did a good job with the Times story. The basic ideas, that
0. Intelligence is (at least crudely) measurable
1. Intelligence is highly heritable (much of the variance is determined by DNA)
2. Intelligence is highly polygenic (controlled by many genetic variants, each of small effect)
3. Intelligence is going to be deciphered at the molecular level, in the near future, by genomic studies with very large sample size 
are now supported by overwhelming scientific evidence. Nevertheless, they are and have been heavily contested by anti-Science ideologues.

For further discussion of points (0-3), see my article On the genetic architecture of intelligence and other quantitative traits.

Monday, July 23, 2018

SSGAC EA3: genomic prediction of educational attainment and related cognitive phenotypes

Years ago I predicted that:

1. Cognitive ability would turn out to be influenced by many thousands of genetic variants, each of small effect.

2. With large enough sample size we would detect these variants and eventually construct genomic predictors.

The Nature Genetics paper below from the SSGAC collaboration takes a significant step in that direction.

Although the study used over a million genotypes, the data had to be aggregated across many sub-cohorts using summary statistics only. This does not permit the L1-penalized optimization we used to build our height predictor.

For out of sample validation of the results below, see this PNAS paper, which (unusually) appeared before the paper on which it is based.

The lead author James Lee is on the left below. Chris Chang, author of Plink 2.0, is on the right. The photo was taken in 2010 at BGI -- they are standing in front of crates of Illumina sequencers.


Article | Published: 23 July 2018

Gene discovery and polygenic prediction from a genome-wide association study of educational attainment in 1.1 million individuals

James J. Lee, Robbee Wedow, […]David Cesarini
Nature Genetics (2018)

Abstract
Here we conducted a large-scale genetic association analysis of educational attainment in a sample of approximately 1.1 million individuals and identify 1,271 independent genome-wide-significant SNPs. For the SNPs taken together, we found evidence of heterogeneous effects across environments. The SNPs implicate genes involved in brain-development processes and neuron-to-neuron communication. In a separate analysis of the X chromosome, we identify 10 independent genome-wide-significant SNPs and estimate a SNP heritability of around 0.3% in both men and women, consistent with partial dosage compensation. A joint (multi-phenotype) analysis of educational attainment and three related cognitive phenotypes generates polygenic scores that explain 11–13% of the variance in educational attainment and 7–10% of the variance in cognitive performance. This prediction accuracy substantially increases the utility of polygenic scores as tools in research.
A nice figure from the paper: Add Health (National Longitudinal Study of Adolescent to Adult Health) and HRS (Health in Retirement Study) are two longitudinal cohorts that have been genotyped; horizontal axis is polygenic score. It appears that individuals with top quintile polygenic scores are about 5 times more likely to complete college than bottom quintile individuals.


Here's a comment on the paper I provided to a journalist:
The EA3 predictor correlates about 0.35 with educational attainment, and slightly less well with measured cognitive ability. While this is far from perfect prediction, it does allow identification of individuals, using DNA alone, who are at unusual risk of being well below average in cognitive ability or struggling in school. Standardized tests, such as SAT, ACT, GRE, LSAT, etc., typically also correlate roughly 0.35 with educational outcomes like grade point average, degree completion, etc. In this sense, the genomic predictor is comparable to widely used tests and it will certainly improve as more data are analyzed. See figure.

Wednesday, May 11, 2016

74 SNP hits from SSGAC GWAS


The SSGAC discovery of 74 SNP hits on educational attainment (EA) is finally published in Nature. Nature News article.

EA was used in order to assemble as large a sample as possible (~300k individuals). Specific cognitive scores are only available for a much smaller number of individuals. But SNPs associated with EA are likely to also be associated with cognitive ability -- see figure above.

The evidence is strong that cognitive ability is highly heritable and highly polygenic. With even larger samples we'll eventually be able to build good genomic predictors for cognitive ability.
Genome-wide association study identifies 74 loci associated with educational attainment A. Okbay et al. Nature http://dx.doi.org/10.1038/nature17671; 2016

Educational attainment is strongly influenced by social and other environmental factors, but genetic factors are estimated to account for at least 20% of the variation across individuals1. Here we report the results of a genome-wide association study (GWAS) for educational attainment that extends our earlier discovery sample1,2 of 101,069 individuals to 293,723 individuals, and a replication study in an independent sample of 111,349 individuals from the UK Biobank. We identify 74 genome-wide significant loci associated with the number of years of schooling completed. Single- nucleotide polymorphisms associated with educational attainment are disproportionately found in genomic regions regulating gene expression in the fetal brain. Candidate genes are preferentially expressed in neural tissue, especially during the prenatal period, and enriched for biological pathways involved in neural development. Our findings demonstrate that, even for a behavioural phenotype that is mostly environmentally determined, a well-powered GWAS identifies replicable associated genetic variants that suggest biologically relevant pathways. Because educational attainment is measured in large numbers of individuals, it will continue to be useful as a proxy phenotype in efforts to characterize the genetic influences of related phenotypes, including cognition and neuropsychiatric diseases.

Here's what I wrote back in September of 2015, based on a talk given by James Lee on this work.
James Lee talk at ISIR 2015 (via James Thompson) reports on 74 hits at genome-wide statistical significance (p < 5E-8) using educational attainment as the phenotype. Most of these will also turn out to be hits on cognitive ability.

To quote James: "Shock and Awe" for those who doubt that cognitive ability is influenced by genetic variants. This is just the tip of the iceberg, though. I expect thousands more such variants to be discovered before we have accounted for all of the heritability.
74 GENOMIC SITES ASSOCIATED WITH EDUCATIONAL ATTAINMENT PROVIDE INSIGHT INTO THE BIOLOGY OF COGNITIVE PERFORMANCE 
James J Lee

University of Minnesota Twin Cities
Social Science Genetic Association Consortium

Genome-wide association studies (GWAS) have revealed much about the biological pathways responsible for phenotypic variation in many anthropometric traits and diseases. Such studies also have the potential to shed light on the developmental and mechanistic bases of behavioral traits.

Toward this end we have undertaken a GWAS of educational attainment (EA), an outcome that shows phenotypic and genetic correlations with cognitive performance, personality traits, and other psychological phenotypes. We performed a GWAS meta-analysis of ~293,000 individuals, applying a variety of methods to address quality control and potential confounding. We estimated the genetic correlations of several different traits with EA, in essence by determining whether single-nucleotide polymorphisms (SNPs) showing large statistical signals in a GWAS meta-analysis of one trait also tend to show such signals in a meta-analysis of another. We used a variety of bio-informatic tools to shed light on the biological mechanisms giving rise to variation in EA and the mediating traits affecting this outcome. We identified 74 independent SNPs associated with EA (p < 5E-8). The ability of the polygenic score to predict within-family differences suggests that very little of this signal is due to confounding. We found that both cognitive performance (0.82) and intracranial volume (0.39) show substantial genetic correlations with EA. Many of the biological pathways significantly enriched by our signals are active in early development, affecting the proliferation of neural progenitors, neuron migration, axonogenesis, dendrite growth, and synaptic communication. We nominate a number of individual genes of likely importance in the etiology of EA and mediating phenotypes such as cognitive performance.
For a hint at what to expect as more data become available, see Five Years of GWAS Discovery and On the genetic architecture of intelligence and other quantitative traits.


What was once science fiction will soon be reality.
Long ago I sketched out a science fiction story involving two Junior Fellows, one a bioengineer (a former physicist, building the next generation of sequencing machines) and the other a mathematician. The latter, an eccentric, was known for collecting signatures -- signed copies of papers and books authored by visiting geniuses (Nobelists, Fields Medalists, Turing Award winners) attending the Society's Monday dinners. He would present each luminary with an ornate (strangely sticky) fountain pen and a copy of the object to be signed. Little did anyone suspect the real purpose: collecting DNA samples to be turned over to his friend for sequencing! The mathematician is later found dead under strange circumstances. Perhaps he knew too much! ...

Thursday, February 26, 2015

Evidence for polygenicity in GWAS

This paper describes a method to distinguish between polygenic causality and confounding (e.g., from population structure) in GWAS.

LD Score regression distinguishes confounding from polygenicity in genome-wide association studies

Nature Genetics 47, 291–295 (2015) doi:10.1038/ng.3211

Both polygenicity (many small genetic effects) and confounding biases, such as cryptic relatedness and population stratification, can yield an inflated distribution of test statistics in genome-wide association studies (GWAS). However, current methods cannot distinguish between inflation from a true polygenic signal and bias. We have developed an approach, LD Score regression, that quantifies the contribution of each by examining the relationship between test statistics and linkage disequilibrium (LD). The LD Score regression intercept can be used to estimate a more powerful and accurate correction factor than genomic control. We find strong evidence that polygenicity accounts for the majority of the inflation in test statistics in many GWAS of large sample size.
The basic idea is straightforward, however the technique yields good evidence for polygenicity.
Variants in LD with a causal variant show an elevation in test statistics in association analysis proportional to their LD (measured by r2) with the causal variant1–3. The more genetic variation an index variant tags, the higher the probability that this index variant will tag a causal variant. In contrast, inflation from cryptic relatedness within or between cohorts4–6 or population stratification purely from genetic drift will not correlate with LD.

...

Real data

Finally, we applied LD Score regression to summary statistics from GWAS representing more than 20 different phenotypes15–32 (Table 1 and Supplementary Fig. 8a–w; metadata about the studies in the analysis are presented in Supplementary Table 8a,b). For all studies, the slope of the LD Score regression was significantly greater than zero and the LD Score regression intercept was substantially less than λGC (mean difference of 0.11), suggesting that polygenicity accounts for a majority of the increase in the mean χ2 statistic and confirming that correcting test statistics by dividing by λGC is unnecessarily conservative. As an example, we show the LD Score regression for the most recent schizophrenia GWAS, restricted to ~70,000 European-ancestry individuals (Fig. 2)32. The low intercept of 1.07 indicates at most a small contribution of bias and that the mean χ2 statistic of 1.613 results mostly from polygenicity.
Figures from the Supplement. "Years of Education" refers to the SSGAC study which identified the first SNPs associated with cognitive ability. See First Hits for Cognitive Ability, and more posts here.

Monday, August 14, 2017

Estimation of genetic architecture for complex traits using GWAS data

These authors extrapolate from existing data to predict sample sizes needed to identify SNPs which explain a large portion of heritability in a variety of traits. For cognitive ability (see red curves in figure below), they predict sample sizes of ~million individuals will suffice.

See also More Shock and Awe: James Lee and SSGAC in Oslo, 600 SNP hits.
Estimation of complex effect-size distributions using summary-level statistics from genome-wide association studies across 32 complex traits and implications for the future

Yan Zhang, Guanghao Qi, Ju-Hyun Park, Nilanjan Chatterjee (Johns Hopkins University)

Summary-level statistics from genome-wide association studies are now widely used to estimate heritability and co-heritability of traits using the popular linkage-disequilibrium-score (LD-score) regression method. We develop a likelihood-based approach for analyzing summary-level statistics and external LD information to estimate common variants effect-size distributions, characterized by proportion of underlying susceptibility SNPs and a flexible normal-mixture model for their effects. Analysis of summary-level results across 32 GWAS reveals that while all traits are highly polygenic, there is wide diversity in the degrees of polygenicity. The effect-size distributions for susceptibility SNPs could be adequately modeled by a single normal distribution for traits related to mental health and ability and by a mixture of two normal distributions for all other traits. Among quantitative traits, we predict the sample sizes needed to identify SNPs which explain 80% of GWAS heritability to be between 300K-500K for some of the early growth traits, between 1-2 million for some anthropometric and cholesterol traits and multiple millions for body mass index and some others. The corresponding predictions for disease traits are between 200K-400K for inflammatory bowel diseases, close to one million for a variety of adult onset chronic diseases and between 1-2 million for psychiatric diseases.


This figure shows predicted effect size distributions for a number of quantitative traits. You can see that height and intelligence are somewhat different, but not dramatically so.

Monday, September 08, 2014

Common genetic variants associated with cognitive performance

This is a follow up to earlier papers by the SSGAC collaboration -- see First GWAS Hits For Cognitive Ability and SNPs and SATS. Effect sizes found are typically ~ 0.3 IQ points. Someone with 50 more good variants (similar to these) than the average person would be about 1 SD above average in IQ.

Note among the authors names like Pinker, Visscher, Plomin, McGue, Deary, etc. Thank god it wasn't the sinister Chinese who got there first! For more on this topic, including the status of the BGI study, see Genetic Architecture of Intelligence (arXiv:1408.3421).
Common genetic variants associated with cognitive performance identified using the proxy-phenotype method (PNAS, doi: 10.1073/pnas.1404623111)

We identify common genetic variants associated with cognitive performance using a two-stage approach, which we call the proxy-phenotype method. First, we conduct a genome-wide association study of educational attainment in a large sample (n = 106,736), which produces a set of 69 education-associated SNPs. Second, using independent samples (n = 24,189), we measure the association of these education-associated SNPs with cognitive performance. Three SNPs (rs1487441, rs7923609, and rs2721173) are significantly associated with cognitive performance after correction for multiple hypothesis testing. In an independent sample of older Americans (n = 8,652), we also show that a polygenic score derived from the education-associated SNPs is associated with memory and absence of dementia. Convergent evidence from a set of bioinformatics analyses implicates four specific genes (KNCMA1, NRXN1, POU2F3, and SCRT). All of these genes are associated with a particular neurotransmitter pathway involved in synaptic plasticity, the main cellular mechanism for learning and memory.

Wednesday, July 25, 2018

Genomic Prediction: A Hypothetical (Embryo Selection)

The new SSGAC EA3 paper in Nature Genetics contains the following figure.


Add Health (National Longitudinal Study of Adolescent to Adult Health) and HRS (Health in Retirement Study) are two longitudinal cohorts under study by social scientists. Horizontal axis is polygenic score (computed from DNA alone). It appears that individuals with top quintile polygenic scores are about 5 times more likely to complete college than bottom quintile individuals.  (IIUC, HRS cohort grew up in an earlier era when college attendance rates were lower; Add Health participants are younger.)

Consider the following hypothetical:
You are an IVF physician advising parents who have exactly 2 viable embryos, ready for implantation. The parents want to implant only one embryo. 
All genetic and morphological information about the embryos suggest that they are both viable, healthy, and free of elevated disease risk.

However, embryo A has polygenic score (as in figure above) in the lowest quintile (elevated risk of struggling in school) while embryo B has polygenic score in the highest quintile (less than average risk of struggling in school). We could sharpen the question by assuming, e.g., that embryo A has score in the bottom 1% while embryo B is in the top 1%.

You have no other statistical or medical information to differentiate between the two embryos.

What do you tell the parents? Do you inform them about the polygenic score difference between the embryos?
Note, in the very near future this question will no longer be hypothetical...

See Nativity 2050 and The Future is Here: Genomic Prediction in MIT Technology Review.

Sunday, August 19, 2018

Genomic Prediction: A Hypothetical (Embryo Selection), Part 2

The figures below are from the recent paper Genome-wide polygenic scores for common diseases identify individuals with risk equivalent to monogenic mutations (Nature Genetics), discussed previously here.

As you can see, genomic prediction of risk allows to identify outliers for conditions like heart disease and diabetes. Individuals who are top 1% in polygenic risk score are many times (approaching an order of magnitude) more likely to exhibit the condition than the typical person.

In an earlier post, Genomic Prediction: A Hypothetical (Embryo Selection), I pointed out a similar situation with regard to the SSGAC predictor for Educational Attainment. Negative outliers on that polygenic score (e.g., bottom 1%) are much more likely to have difficulty in school. I then posed this hypothetical:
You are an IVF physician advising parents who have exactly 2 viable embryos, ready for implantation.

The parents want to implant only one embryo.

All genetic and morphological information about the embryos suggest that they are both viable, healthy, and free of elevated disease risk.

However, embryo A has polygenic score (as in figure above) in the lowest quintile (elevated risk of struggling in school) while embryo B has polygenic score in the highest quintile (less than average risk of struggling in school). We could sharpen the question by assuming, e.g., that embryo A has score in the bottom 1% while embryo B is in the top 1%.

You have no other statistical or medical information to differentiate between the two embryos.

What do you tell the parents? Do you inform them about the polygenic score difference between the embryos?
We can pose the analogous hypothetical for the risk scores displayed below. Should the parents be informed if, for instance, one of the embryos is in the top 1% risk for heart disease or Type 2 Diabetes? Is there a difference between the case of the EA predictor and disease risk predictors?

In the case of monogenic (Mendelian) genetic risk, e.g., Tay-Sachs, Cystic Fibrosis, BRCA, etc., deliberate genetic screening is increasingly common, even if penetrance is imperfect (i.e., the probability of the condition given the presence of the risk variant is less than 100%).

Note, the risk ratio between top 1% and bottom 1% individuals is potentially very large (see below), although more careful analysis is probably required to understand this better.

These hypotheticals will not be hypothetical for very much longer: the future is here.


(CAD = coronary artery disease.)


Wednesday, September 30, 2015

Disruptive mutations and the genetic architecture of autism


New results on the genetic architecture of autism support Mike Wigler's Unified Theory. See earlier post De Novo Mutations and Autism. Recent increases in the incidence of autism could be mainly due to greater diagnostic awareness. However, the new result that women can be carriers of autism-linked variants without exhibiting the same kinds of symptoms as men might alter the usual analysis of the role of assortative mating. Perhaps women who are carriers are predisposed to marry nerdy (but mostly asymptomatic) males who also carry above average mutational load in autism genes?

I suspect many of the ~200 genes identified in this study will overlap with the ~80 SNPs recently found by SSGAC to be associated with cognitive ability. The principle of continuity suggests that in addition to ultra-rare variants with "devastating" effects, there are many moderately rare variants (also under negative, but weaker, selection due to smaller effect size) affecting the same pathways. These would contribute to variance in cognitive ability within the normal population. More discussion in section 3 of On the Genetic Architecture of Intelligence.
Neuroscience News: Quantitative study identifies 239 genes whose ‘vulnerability’ to devastating de novo mutation makes them priority research targets.

... devastating “ultra-rare” mutations of genes that they classify as “vulnerable” play a causal role in roughly half of all ASD cases. The vulnerable genes to which they refer harbor what they call an LGD, or likely gene-disruption. These LGD mutations can occur “spontaneously” between generations, and when that happens they are found in the affected child but not found in either parent.

Although LGDs can impair the function of key genes, and in this way have a deleterious impact on health, this is not always the case. The study, whose first author is the quantitative biologist Ivan Iossifov, a CSHL assistant professor and on faculty at the New York Genome Center, finds that “autism genes” – i.e., those that, when mutated, may contribute to an ASD diagnosis – tend to have fewer mutations than most genes in the human gene pool.

This seems paradoxical, but only on the surface. Iossifov explains that genes with devastating de novo LGD mutations, when they occur in a child and give rise to autism, usually don’t remain in the gene pool for more than one generation before they are, in evolutionary terms, purged. This is because those born with severe autism rarely reproduce.

The team’s data helps the research community prioritize which genes with LGDs are most likely to play a causal role in ASD. The team pares down a list of about 500 likely causal genes to slightly more than 200 best “candidate” autism genes.

The current study also sheds new light on the transmission to children of LGDs that are carried by parents who harbor them but whose health is nevertheless not severely affected. Such transmission events were observed and documented in the families used in the study, comprising the Simons Simplex Collection (SSC). When parents carry potentially devastating LGD mutations, these are more frequently found in the ASD-affected children than in their unaffected children, and most often come from the mother.

This result supports a theory first published in 2007 by senior author Michael Wigler, a CSHL professor, and Dr. Kenny Ye, a statistician at Albert Einstein College of Medicine. They predicted that unaffected mothers are “carriers” of devastating mutations that are preferentially transmitted to children affected with severe ASD. Females have an as yet unexplained factor that protects them from mutations which, when they occur in males, will be significantly more likely to cause ASD. It is well known that at least four times as many males as females have ASD.

Wigler’s 2007 “unified theory” of sporadic autism causation predicted precisely this effect. “Devastating de novo mutations in autism genes should be under strong negative selection pressure,” he explains. “And that is among the findings of the paper we’re publishing today. Our analysis also revealed that a surprising proportion of rare devastating mutations transmitted by parents occurs in genes expressed in the embryonic brain.” This finding tends to support theories suggesting that at least some of the gene mutations with the power to cause ASD occur in genes that are indispensable for normal brain development.
Here is the paper at PNAS:
Low load for disruptive mutations in autism genes and their biased transmission

We previously computed that genes with de novo (DN) likely gene-disruptive (LGD) mutations in children with autism spectrum disorders (ASD) have high vulnerability: disruptive mutations in many of these genes, the vulnerable autism genes, will have a high likelihood of resulting in ASD. Because individuals with ASD have lower fecundity, such mutations in autism genes would be under strong negative selection pressure. An immediate prediction is that these genes will have a lower LGD load than typical genes in the human gene pool. We confirm this hypothesis in an explicit test by measuring the load of disruptive mutations in whole-exome sequence databases from two cohorts. We use information about mutational load to show that lower and higher intelligence quotients (IQ) affected individuals can be distinguished by the mutational load in their respective gene targets, as well as to help prioritize gene targets by their likelihood of being autism genes. Moreover, we demonstrate that transmission of rare disruptions in genes with a lower LGD load occurs more often to affected offspring; we show transmission originates most often from the mother, and transmission of such variants is seen more often in offspring with lower IQ. A surprising proportion of transmission of these rare events comes from genes expressed in the embryonic brain that show sharply reduced expression shortly after birth.

Monday, July 28, 2014

SNPs and SATS

This paper provides additional support that the GWAS hits found by SSGAC affect cognitive ability. My guess is that UK age 14 SATS scores are pretty g-loaded. Note this is an ethnically homogeneous sample of students.

If the effect size per allele is about 1/30 SD, it would take ~1000 to account for normal population variation. These are the first loci detected, so typical effect size of alleles affecting cognitive ability is probably smaller. This seems consistent with my estimate of ~10k causal variants.

Genetic Variation Associated with Differential Educational Attainment in Adults Has Anticipated Associations with School Performance in Children (PLoS July 17, 2014 DOI: 10.1371/journal.pone.0100248)

Genome-wide association study results have yielded evidence for the association of common genetic variants with crude measures of completed educational attainment in adults. Whilst informative, these results do not inform as to the mechanism of these effects or their presence at earlier ages and where educational performance is more routinely and more precisely assessed. Single nucleotide polymorphisms exhibiting genome-wide significant associations with adult educational attainment were combined to derive an unweighted allele score in 5,979 and 6,145 young participants from the Avon Longitudinal Study of Parents and Children with key stage 3 national curriculum test results (SATS results) available at age 13 to 14 years in English and mathematics respectively. Standardised (z-scored) results for English and mathematics showed an expected relationship with sex, with girls exhibiting an advantage over boys in English (0.433 SD (95%CI 0.395, 0.470), p<10−10) with more similar results (though in the opposite direction) in mathematics (0.042 SD (95%CI 0.004, 0.080), p = 0.030). Each additional adult educational attainment increasing allele was associated with 0.041 SD (95%CI 0.020, 0.063), p = 1.79×10−04 and 0.028 SD (95%CI 0.007, 0.050), p = 0.01 increases in standardised SATS score for English and mathematics respectively. Educational attainment is a complex multifactorial behavioural trait which has not had heritable contributions to it fully characterised. We were able to apply the results from a large study of adult educational attainment to a study of child exam performance marking events in the process of learning rather than realised adult end product. Our results support evidence for common, small genetic contributions to educational attainment, but also emphasise the likely lifecourse nature of this genetic effect. Results here also, by an alternative route, suggest that existing methods for child examination are able to recognise early life variation likely to be related to ultimate educational attainment.

Friday, July 26, 2019

RadioLab on embryo selection in IVF


I'm in this RadioLab podcast covering genetic selection of embryos in IVF. Apologies to SSGAC, Robert Plomin, Ian Deary, James Lee, Tom Bouchard, and countless other dedicated scientists for the impression given that progress in genomics of cognitive ability is largely my work. See last paragraph below.

This is the email I sent to RadioLab this morning:
Hi Pat and Michelle,

Congratulations on a high quality podcast. I thought you were admirably fair and balanced. I also thought the production (esp. the music) was excellent.

My main comment is that the juxtaposition between my remarks and Benjamin's is misleading: when he says 60-40 or 55% chance of rank ordering properly, that is a very different question than identifying an outlier who is, say, among the 1% highest in risk. We are not trying to rank order embryos, but to warn against unusual risk of a medical condition.

To use the SAT analogy, given two kids with scores 1250 and 1200, only some of the time does the 1250 kid end up with a higher GPA. (You can't predict rank order very well.) But if the engineering dean admits an SAT 770 kid (i.e., a negative outlier compared to the average score of, say, 1300 among engineers) in his freshman class, he knows the likelihood is high that the kid will struggle. Benjamin is talking about the first scenario, and I am talking about the second.

Finally, I realize that to hook listeners you had to make me the focus of the episode. But I want to make clear that many scientists contribute to this work, which I feel will ultimately be beneficial to our species and civilization. I am just a small part of a worldwide research endeavor.

Best wishes,
Steve
For more on recent progress in genomic prediction, see The Diffusion of Knowledge.

Thursday, April 13, 2017

Penalized regression from summary statistics

One of the difficulties in genomics is that when DNA donors are consented for a study, the agreements generally do not allow sharing (aggregation) of genomic data across multiple studies. This leads to isolated silos of data that can't be fully shared. However, computations can be performed on one silo at a time, with the results ("summary statistics") shared within a larger collaboration. Most of the leading GWAS collaborations (e.g., GIANT for height, SSGAC for cognitive ability) rely on shared statistics. Simple regression analysis (one SNP at a time) can be conducted using just summary statistics, but more sophisticated algorithms cannot. These more sophisticated methods can generate a better phenotype predictor, using less data, than a SNP by SNP analysis.

For example, the objective function used in LASSO (L1-penalized regression) is of the form


where, for the genomics problem, y is the phenotype vector, X the matrix of genomes, beta the vector of effect sizes, and lambda the penalization. Optimization of this function seems to require access to the full matrix X and vector y -- i.e., requires access to potentially all the genomes and phenotypes at once. Is there a modified version of the algorithm that works on summary statistics, where only subsets of X and y are available? Carson Chow has advocated this approach to me for some time. If one can separately estimate X'X (LD matrix of genomic correlations), and gather X'y (phenotype-SNP correlations) from summary statistics, then LASSO over silo-ed data may become a reality. Of course, the devil is in the details. The paper below describes an approach to this problem.
Polygenic scores via penalized regression on summary statistics

Timothy Mak, Robert Milan Porsch, Shing Wan Choi, Xueya Zhou, Pak Chung Sham
doi: https://doi.org/10.1101/058214

Polygenic scores (PGS) summarize the genetic contribution of a person's genotype to a disease or phenotype. They can be used to group participants into different risk categories for diseases, and are also used as covariates in epidemiological analyses. A number of possible ways of calculating polygenic scores have been proposed, and recently there is much interest in methods that incorporate information available in published summary statistics. As there is no inherent information on linkage disequilibrium (LD) in summary statistics, a pertinent question is how we can make use of LD information available elsewhere to supplement such analyses. To answer this question we propose a method for constructing PGS using summary statistics and a reference panel in a penalized regression framework, which we call lassosum. We also propose a general method for choosing the value of the tuning parameter in the absence of validation data. In our simulations, we showed that pseudovalidation often resulted in prediction accuracy that is comparable to using a dataset with validation phenotype and was clearly superior to the conservative option of setting the tuning parameter of lassosum to its lowest value. We also showed that lassosum achieved better prediction accuracy than simple clumping and p-value thresholding in almost all scenarios. It was also substantially faster and more accurate than the recently proposed LDpred.
See also Bayesian large-scale multiple regression with summary statistics from genome-wide association studies.

Friday, September 16, 2016

Genomic prediction of adult life outcomes using SNP genotypes


Genomic prediction of adult life outcomes using SNP genotypes is very close to a reality. This was discussed in an earlier post The Tipping Point. The previous post, Prenatal and pre-implantation genetic diagnosis (Nature Reviews Genetics), describes how genotyping informs the Embryo Selection Problem which arises in In Vitro Fertilization (IVF).

The Adult-Attainment factor in the figure above is computed using inputs such as occupational prestige, income, assets, social welfare benefit use, etc. See Supplement, p.3. The polygenic score is computed using estimated SNP effect sizes from the SSGAC GWAS on educational attainment (i.e., a simple linear model).

A genetic test revealing that a specific embryo is, say, a -2 or -3 SD outlier on the polygenic score would probably give many parents pause, in light of the results in the figure above. The accuracy of this kind of predictor will grow with GWAS sample size in coming years.

Via Professor James Thompson. See also discussion by Stuart Ritchie.
The Genetics of Success: How Single-Nucleotide Polymorphisms Associated With Educational Attainment Relate to Life-Course Development

Psychological Science 2016, Vol. 27(7) 957–972
DOI: 10.1177/0956797616643070

A previous genome-wide association study (GWAS) of more than 100,000 individuals identified molecular-genetic predictors of educational attainment. We undertook in-depth life-course investigation of the polygenic score derived from this GWAS using the four-decade Dunedin Study (N = 918). There were five main findings. First, polygenic scores predicted adult economic outcomes even after accounting for educational attainments. Second, genes and environments were correlated: Children with higher polygenic scores were born into better-off homes. Third, children’s polygenic scores predicted their adult outcomes even when analyses accounted for their social-class origins; social-mobility analysis showed that children with higher polygenic scores were more upwardly mobile than children with lower scores. Fourth, polygenic scores predicted behavior across the life course, from early acquisition of speech and reading skills through geographic mobility and mate choice and on to financial planning for retirement. Fifth, polygenic-score associations were mediated by psychological characteristics, including intelligence, self-control, and interpersonal skill. Effect sizes were small. Factors connecting DNA sequence with life outcomes may provide targets for interventions to promote population-wide positive development.

Tuesday, September 19, 2017

Accurate Genomic Prediction Of Human Height

I've been posting preprints on arXiv since its beginning ~25 years ago, and I like to share research results as soon as they are written up. Science functions best through open discussion of new results! After some internal deliberation, my research group decided to post our new paper on genomic prediction of human height on bioRxiv and arXiv.

But the preprint culture is nascent in many areas of science (e.g., biology), and it seems to me that some journals are not yet fully comfortable with the idea. I was pleasantly surprised to learn, just in the last day or two, that most journals now have official policies that allow online distribution of preprints prior to publication. (This has been the case in theoretical physics since before I entered the field!) Let's hope that progress continues.

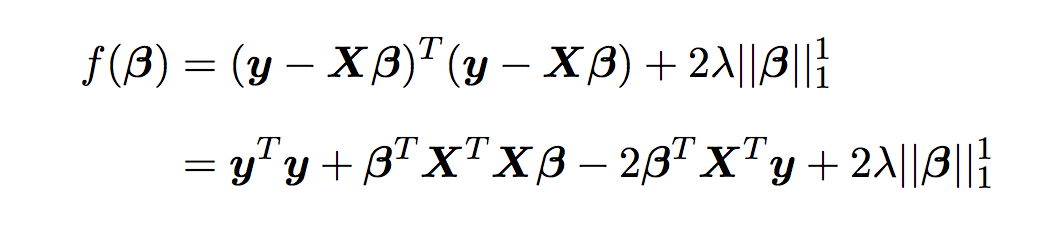
The work presented below applies ideas from compressed sensing, L1 penalized regression, etc. to genomic prediction. We exploit the phase transition behavior of the LASSO algorithm to construct a good genomic predictor for human height. The results are significant for the following reasons:
We applied novel machine learning methods ("compressed sensing") to ~500k genomes from UK Biobank, resulting in an accurate predictor for human height which uses information from thousands of SNPs.

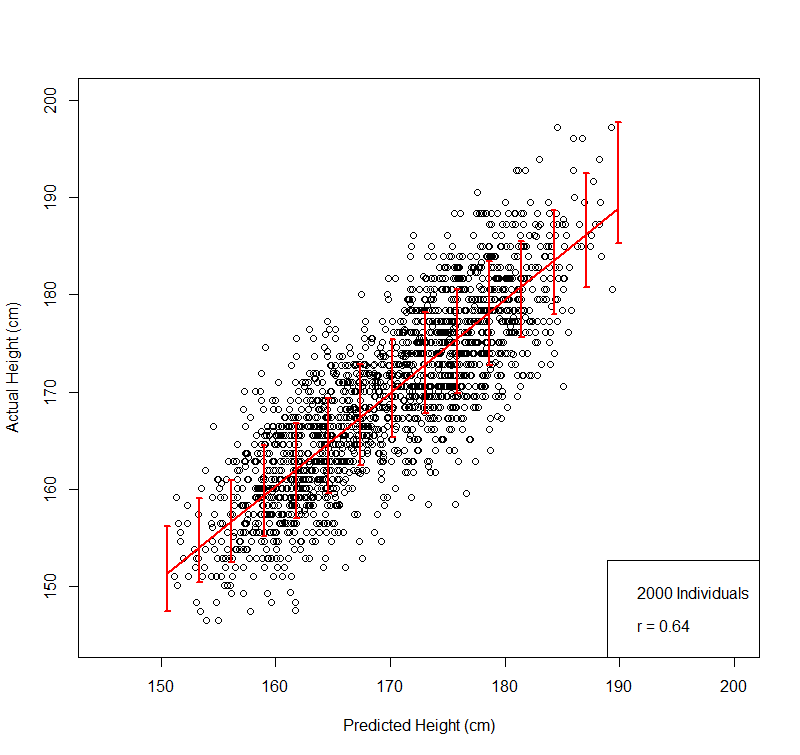
1. The actual heights of most individuals in our replication tests are within a few cm of their predicted height.

2. The variance captured by the predictor is similar to the estimated GCTA-GREML SNP heritability. Thus, our results resolve the missing heritability problem for common SNPs.

3. Out-of-sample validation on ARIC individuals (a US cohort) shows the predictor works on that population as well. The SNPs activated in the predictor overlap with previous GWAS hits from GIANT.
The scatterplot figure below gives an immediate feel for the accuracy of the predictor.
Accurate Genomic Prediction Of Human Height
(bioRxiv)

Louis Lello, Steven G. Avery, Laurent Tellier, Ana I. Vazquez, Gustavo de los Campos, and Stephen D.H. Hsu

We construct genomic predictors for heritable and extremely complex human quantitative traits (height, heel bone density, and educational attainment) using modern methods in high dimensional statistics (i.e., machine learning). Replication tests show that these predictors capture, respectively, ∼40, 20, and 9 percent of total variance for the three traits. For example, predicted heights correlate ∼0.65 with actual height; actual heights of most individuals in validation samples are within a few cm of the prediction. The variance captured for height is comparable to the estimated SNP heritability from GCTA (GREML) analysis, and seems to be close to its asymptotic value (i.e., as sample size goes to infinity), suggesting that we have captured most of the heritability for the SNPs used. Thus, our results resolve the common SNP portion of the “missing heritability” problem – i.e., the gap between prediction R-squared and SNP heritability. The ∼20k activated SNPs in our height predictor reveal the genetic architecture of human height, at least for common SNPs. Our primary dataset is the UK Biobank cohort, comprised of almost 500k individual genotypes with multiple phenotypes. We also use other datasets and SNPs found in earlier GWAS for out-of-sample validation of our results.
This figure compares predicted and actual height on a validation set of 2000 individuals not used in training: males + females, actual heights (vertical axis) uncorrected for gender. For training we z-score by gender and age (due to Flynn Effect for height). We have also tested validity on a population of US individuals (i.e., out of sample; not from UKBB).


This figure illustrates the phase transition behavior at fixed sample size n and varying penalization lambda.


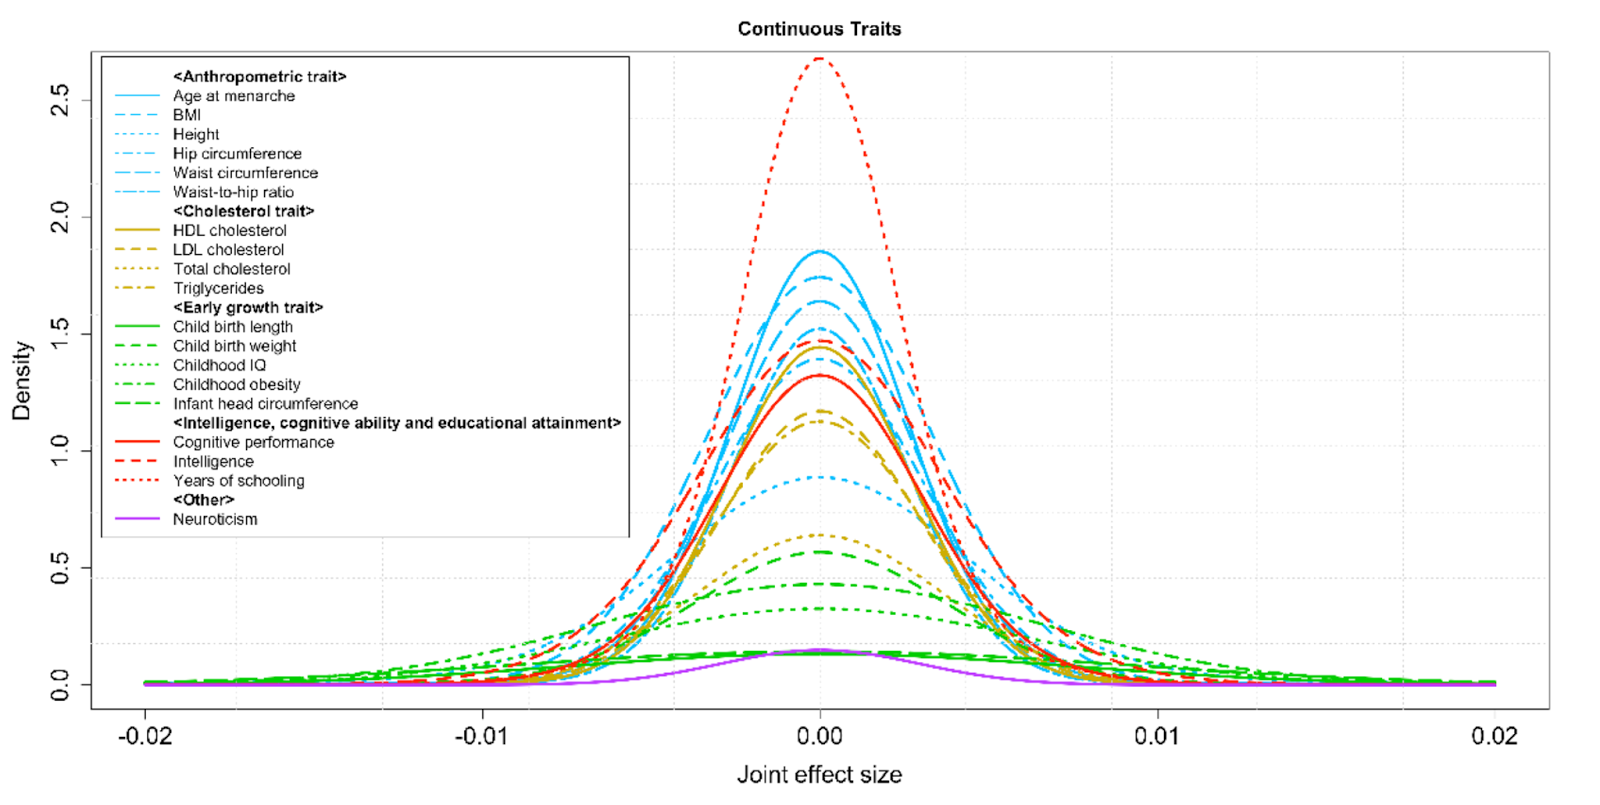
These are the SNPs activated in the predictor -- about 20k in total, uniformly distributed across all chromosomes; vertical axis is effect size of minor allele:


The big picture implication is that heritable complex traits controlled by thousands of genetic loci can, with enough data and analysis, be predicted from DNA. I expect that with good genotype | phenotype data from a million individuals we could 
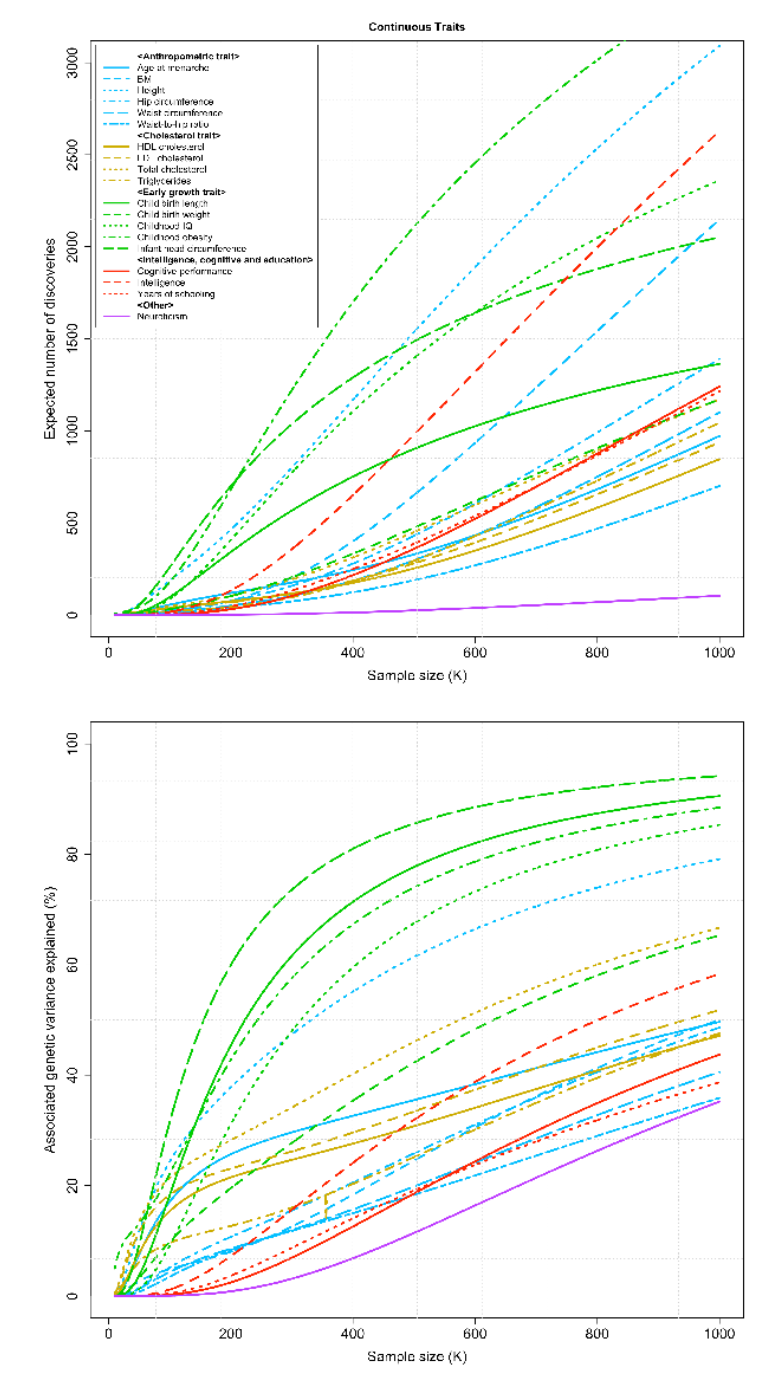
achieve similar success with cognitive ability. We've also analyzed the sample size requirements for 
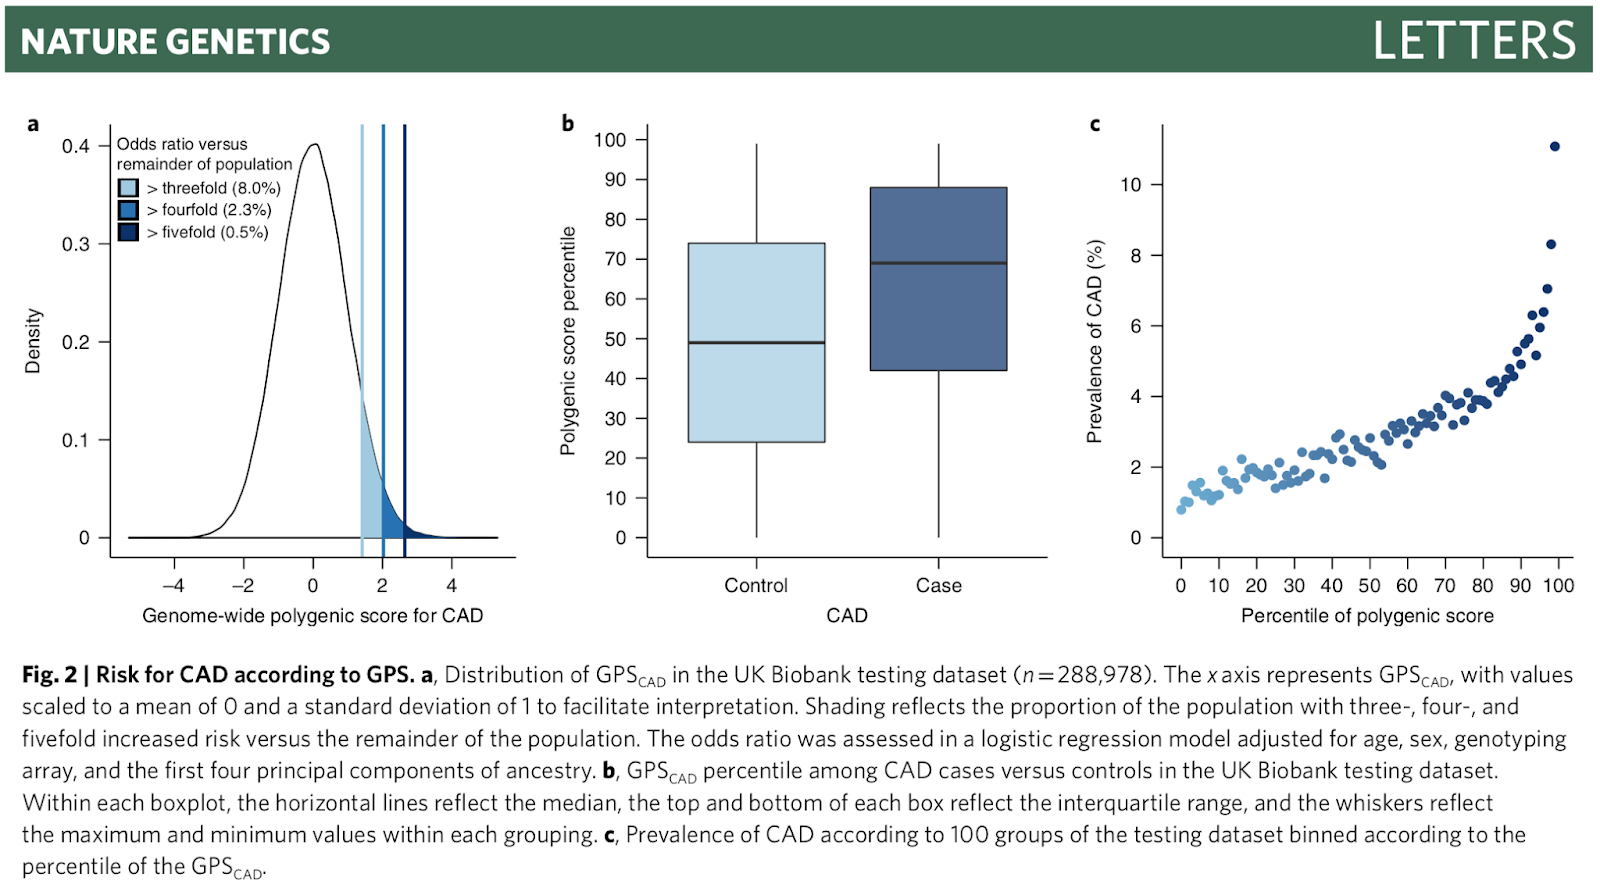
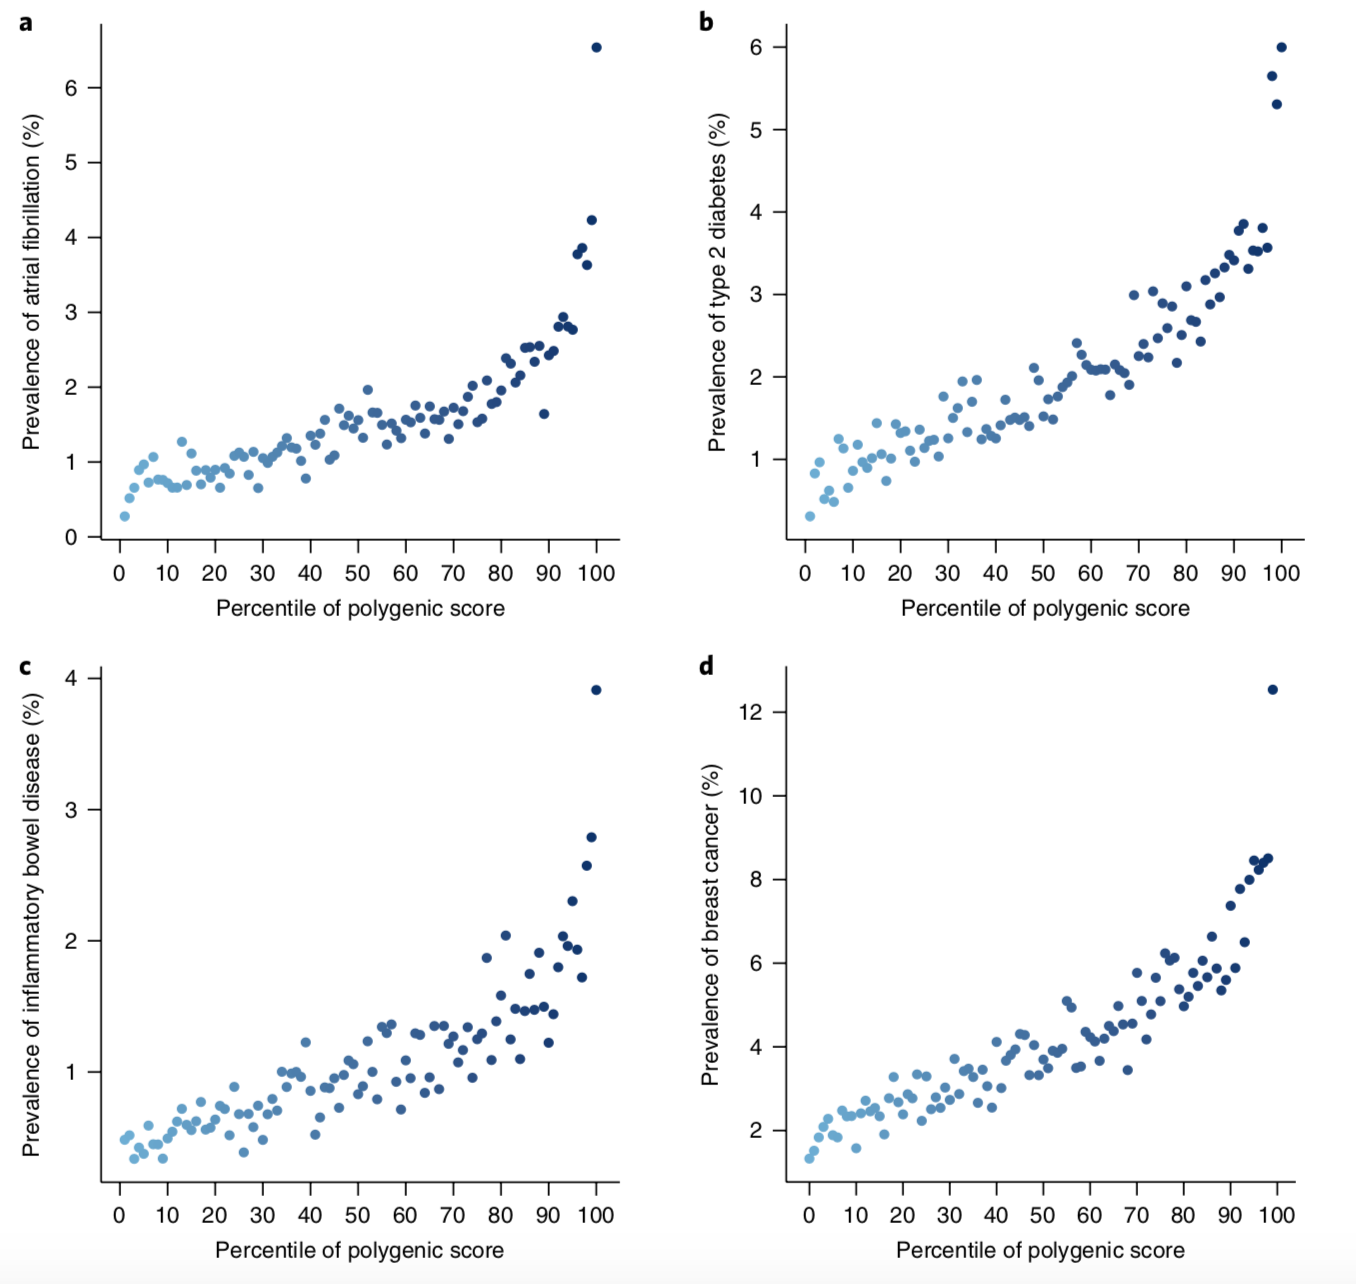
disease risk prediction, and they are similar (i.e., ~100 times sparsity of the effects vector; so ~100k cases + controls for a condition affected by ~1000 loci).


Note Added: Further comments in response to various questions about the paper.

1) We have tested the predictor on other ethnic groups and there is an (expected) decrease in correlation that is roughly proportional to the "genetic distance" between the test population and the white/British training population. This is likely due to different LD structure (SNP correlations) in different populations. A SNP which tags the true causal genetic variation in the Euro population may not be a good tag in, e.g., the Chinese population. We may report more on this in the future. Note, despite the reduction in power our predictor still captures more height variance than any other existing model for S. Asians, Chinese, Africans, etc.

2) We did not explore the biology of the activated SNPs because that is not our expertise. GWAS hits found by SSGAC, GIANT, etc. have already been connected to biological processes such as neuronal growth, bone development, etc. Plenty of follow up work remains to be done on the SNPs we discovered.

3) Our initial reduction of candidate SNPs to the top 50k or 100k is simply to save computational resources. The L1 algorithms can handle much larger values of p, but keeping all of those SNPs in the calculation is extremely expensive in CPU time, memory, etc. We tested computational cost vs benefit in improved prediction from including more (>100k) candidate SNPs in the initial cut but found it unfavorable. (Note, we also had a reasonable prior that ~10k SNPs would capture most of the predictive power.)

4) We will have more to say about nonlinear effects, additional out-of-sample tests, other phenotypes, etc. in future work.

5) Perhaps most importantly, we have a useful theoretical framework (compressed sensing) within which to think about complex trait prediction. We can make quantitative estimates for the sample size required to "solve" a particular trait.

I leave you with some remarks from Francis Crick:
Crick had to adjust from the "elegance and deep simplicity" of physics to the "elaborate chemical mechanisms that natural selection had evolved over billions of years." He described this transition as, "almost as if one had to be born again." According to Crick, the experience of learning physics had taught him something important — hubris — and the conviction that since physics was already a success, great advances should also be possible in other sciences such as biology. Crick felt that this attitude encouraged him to be more daring than typical biologists who tended to concern themselves with the daunting problems of biology and not the past successes of physics.

Monday, July 09, 2018

Game Over: Genomic Prediction of Social Mobility

[ NOTE: The PNAS paper discussed below uses the SSGAC EA3 genomic predictor, trained on over a million genomes. The EA3 paper has now appeared in Nature Genetics. ]

The figure below shows SNP-based polygenic score and life outcome (socioeconomic index, on vertical axis) in four longitudinal cohorts, one from New Zealand (Dunedin) and three from the US. Each cohort (varying somewhat in size) has thousands of individuals, ~20k in total (all of European ancestry). The points displayed are averages over bins containing 10-50 individuals. For each cohort, the individuals have been grouped by childhood (family) social economic status. Social mobility can be predicted from polygenic score. Note that higher SES families tend to have higher polygenic scores on average -- which is what one might expect from a society that is at least somewhat meritocratic. The cohorts have not been used in training -- this is true out-of-sample validation. Furthermore, the four cohorts represent different geographic regions (even, different continents) and individuals born in different decades.

Everyone should stop for a moment and think carefully about the implications of the paragraph above and the figure below.


Caption from the PNAS paper.
Fig. 4. Education polygenic score associations with social attainment for Add Health Study, WLS, Dunedin Study, and HRS participants with low-, middle-, and high-socioeconomic status (SES) social origins. The figure plots polygenic score associations with socioeconomic attainment for Add Health Study (A), Dunedin Study (B), WLS (C), and HRS (D) participants who grew up in low-, middle-, and high-SES households. For the figure, low- middle-, and high-SES households were defined as the bottom quartile, middle 50%, and top quartile of the social origins score distributions for the Add Health Study, WLS, and HRS. For the Dunedin Study, low SES was defined as a childhood NZSEI of two or lower (20% of the sample), middle SES was defined as childhood NZSEI of three to four (63% of the sample), and high SES was defined as childhood NZSEI of five or six (17% of the sample). Attainment is graphed in terms of socioeconomic index scores for the Add Health Study, Dunedin Study, and WLS and in terms of household wealth in the HRS. Add Health Study and WLS socioeconomic index scores were calculated from Hauser and Warren (34) occupational income and occupational education scores. Dunedin Study socioeconomic index scores were calculated similarly, according to the Statistics New Zealand NZSEI (38). HRS household wealth was measured from structured interviews about assets. All measures were z-transformed to have mean = 0, SD = 1 for analysis. The individual graphs show binned scatterplots in which each plotted point reflects average x and y coordinates for a bin of 50 participants for the Add Health Study, WLS, and HRS and for a bin of 10 participants for the Dunedin Study. The red regression lines are plotted from the raw data. The box-and-whisker plots at the bottom of the graphs show the distribution of the education polygenic score for each childhood SES category. The blue diamond in the middle of the box shows the median; the box shows the interquartile range; and the whiskers show upper and lower bounds defined by the 25th percentile minus 1.5× the interquartile range and the 75th percentile plus 1.5× the interquartile range, respectively. The vertical line intersecting the x axis shows the cohort average polygenic score. The figure illustrates three findings observed consistently across cohorts: (i) participants who grew up in higher-SES households tended to have higher socioeconomic attainment independent of their genetics compared with peers who grew up in lower-SES households; (ii) participants’ polygenic scores were correlated with their social origins such that those who grew up in higher-SES households tended to have higher polygenic scores compared with peers who grew up in lower-SES households; (iii) participants with higher polygenic scores tended to achieve higher levels of attainment across strata of social origins, including those born into low-SES families.

The paper:
Genetic analysis of social-class mobility in five longitudinal studies, Belsky et al.

PNAS July 9, 2018. 201801238; published ahead of print July 9, 2018. https://doi.org/10.1073/pnas.1801238115

A summary genetic measure, called a “polygenic score,” derived from a genome-wide association study (GWAS) of education can modestly predict a person’s educational and economic success. This prediction could signal a biological mechanism: Education-linked genetics could encode characteristics that help people get ahead in life. Alternatively, prediction could reflect social history: People from well-off families might stay well-off for social reasons, and these families might also look alike genetically. A key test to distinguish biological mechanism from social history is if people with higher education polygenic scores tend to climb the social ladder beyond their parents’ position. Upward mobility would indicate education-linked genetics encodes characteristics that foster success. We tested if education-linked polygenic scores predicted social mobility in >20,000 individuals in five longitudinal studies in the United States, Britain, and New Zealand. Participants with higher polygenic scores achieved more education and career success and accumulated more wealth. However, they also tended to come from better-off families. In the key test, participants with higher polygenic scores tended to be upwardly mobile compared with their parents. Moreover, in sibling-difference analysis, the sibling with the higher polygenic score was more upwardly mobile. Thus, education GWAS discoveries are not mere correlates of privilege; they influence social mobility within a life. Additional analyses revealed that a mother’s polygenic score predicted her child’s attainment over and above the child’s own polygenic score, suggesting parents’ genetics can also affect their children’s attainment through environmental pathways. Education GWAS discoveries affect socioeconomic attainment through influence on individuals’ family-of-origin environments and their social mobility.

Note Added from comments: Plots would look much noisier if not for averaging many individuals into single point. Keep in mind that socioeconomic success depends on a lot more than just cognitive ability, or even cognitive ability + conscientiousness.

But, underlying predictor correlates ~0.35 with actual educational attainment, IIRC. That is, the polygenic score predicts EA about as well as standardized tests predict success in schooling.

This means you can at least use it to identify outliers: just as a very high/low test score (SAT, ACT, GRE) does not *guarantee* success/failure in school, nevertheless the signal is useful for selection = admissions.

Saturday, May 06, 2017

More Shock and Awe: James Lee and SSGAC in Oslo, 600 SNP hits


To quote James Lee, the first author listed below: "Shock and Awe" for those who doubt that cognitive ability is influenced by genetic variants.

See work from a year ago: ~100 hits from 300k individuals. Now ~600 hits from 750k. (SNPs associated with EA are likely to also be associated with cognitive ability -- see figure at link above.)
47th Behavior Genetics Annual Meeting, Oslo, Norway

GWAS of Educational Attainment, Phase 3: Biological Findings

Abstract
Genetic factors are estimated to account for at least 20% of the variation across individuals for educational attainment (Rietveld et al., 2013). The results of the latest GWAS for educational attainment identified 74 genome-wide significant loci for educational attainment (Okbay et al., 2016). Here, in one of the largest GWAS to date, we increase our sample to nearly 750,000 individuals, and we identify over 600 genome-wide significant loci associated with the number of years of schooling completed. Note that at the time of presentation, we will likely have updated our meta-analysis to include over 1,000,000 individuals

In this presentation, I will focus on the biological implications of the GWAS results. At the time of writing, 1,656 genes are significantly prioritized, a more than 10-fold increase since our previous report (Okbay et al., 2016). The newly significant results reinforce the biological theme of prenatal brain development and also bring to the foreground new themes that shed light on the biological underpinnings of cognitive performance and other traits affecting educational attainment.

Authors
James Lee (University of Minnesota - Twin Cities), Aysu Okbay (Free University Amsterdam), Robbee Wedow (University of Colorado - Boulder), Edward Kong (Harvard University), Patrick Turley (Broad Institute of MIT and Harvard), Meghan Zacher (Harvard University), Kevin Thom (New York University), Anh Tuan Nguyen Viet (University of Southern California), Omeed Maghzian (Harvard University, NBER), Richard Karlsson Linnér (Vrije Universiteit Amsterdam), Matthew Robinson (The University of Queensland), Social Science Genetic Association Consortium (NA), Peter Visscher (The University of Queensland), Daniel Benjamin (University of Southern California), David Cesarini (New York University)
Note the data here have only been analyzed using summary statistics coming from each sub-cohort. More powerful methods may soon become available:
Penalized regression from summary statistics

One of the difficulties in genomics is that when DNA donors are consented for a study, the agreements generally do not allow sharing (aggregation) of genomic data across multiple studies. This leads to isolated silos of data that can't be fully shared. However, computations can be performed on one silo at a time, with the results ("summary statistics") shared within a larger collaboration. Most of the leading GWAS collaborations (e.g., GIANT for height, SSGAC for cognitive ability) rely on shared statistics. Simple regression analysis (one SNP at a time) can be conducted using just summary statistics, but more sophisticated algorithms cannot. These more sophisticated methods can generate a better phenotype predictor, using less data, than a SNP by SNP analysis.
A successful implementation like the one described at the link above could produce many (several times!) more hits and significantly more variance accounted for by corresponding predictors. Stay tuned!

Note Added: I'm getting lots of questions about how to interpret these results, so here are some comments.

1. I predicted ~10k variants would account for most of the heritability due to common SNPs (i.e., about 50% of total variance; allowing a predictor which correlates ~0.7 with actual cognitive ability). The rate of discovery of genome-wide significant hits and corresponding variance accounted for seems consistent with this prediction. Genetic associations are most easily discovered for variants which are common (e.g., have ~0.5 Minor Allele Frequency, not 0.05) and have large effect sizes. But alleles with this combination of properties are rare. As statistical power increases, one starts to discover (more and more) variants of lower frequency and/or lower effect size. A reasonable guess at the genetic architecture suggests a higher density of such variants, and is consistent with an accelerating rate of discovery of SNP hits (~100 hits from 300k individuals, ~600 hits from 750k). There are more efficient methods that, I believe, would discover nearly all the variants given sample size of ~1M well-phenotyped individuals. But these methods require more than just summary statistics.

I made a similar prediction of ~10k variants for height, and our (unpublished) genomic prediction results make me fairly confident that this will turn out to be correct. We now have moderately good height predictors and they are getting better very fast. That ~10k variants will turn out to be responsible for most of the variation in cognitive ability is still at a somewhat lower confidence level.

2. People are still confused about how many + variants above the mean in the population are required to make a "genius" (or super-genius). I managed to compress the explanation enough to fit in a tweet:
Flip coin 10000 times. 5000 + sqrt(10000)/2 = 5050 heads is +1SD outcome. 5100 is +2SD, etc. sqrt(N) << N for N large. Binomial~Normal dist.
You can see that even if cognitive ability is controlled by ~10k variants, flipping only ~100 of them is enough to cause a big difference in actual intelligence. Flipping a few hundred could get us to super-geniuses beyond anything in human history.

3. If you read press accounts related to our creation of the BGI Cognitive Genomics Lab back in 2011 (at that time there were zero genome-wide significant alleles associated with intelligence), you can find quotes from genomics "experts" asserting that mankind would never discover the genetic architecture of cognitive ability. (Such quotes are easy to obtain even today!) A Bayesian update given what is known in 2017 would call into question the competence of these "experts"!  ;-)

Blog Archive

Labels