
Climate destruction 1: Economic Growth
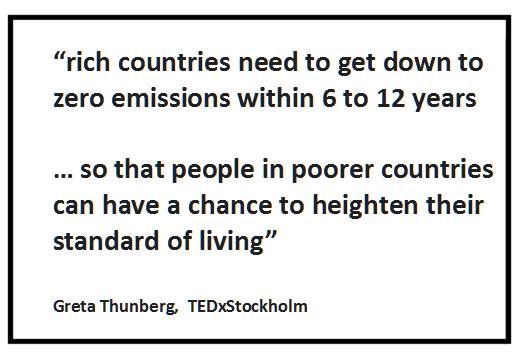
It may be presumptuous to comment on anything Greta Thunberg says but here she gives an excellent example of how the affluent are destroying the climate – even the more well-meaning ones.
Greta beats the boring numbers below.
I have struggled to make what follows both simple and clear so first here is a summary:
- Consumption causes greenhouse gas emissions
- Greenhouse gas emissions cause climate change
- Climate change means consumption must be reduced
- The affluent consume far more than the poor
- The affluent must reduce their enormous consumption
- The poor should be supported
There is an appendix on worries about the state of climate science.
The details follow…
Emissions intensity and economic growth

Almost everything you buy will have caused the emission of greenhouse gasses that drive climate change. Mike Berners-Lee has estimated that for every £1000 you spend on a new car, its production has caused the emission of 636 Kgs of CO2 – plus some other greenhouse gasses [Note 1].
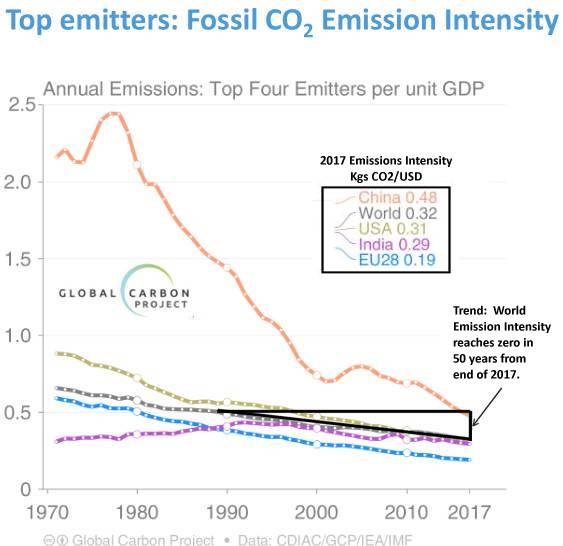
The Global Carbon Project has estimated that, in 2017, for every £1000 spent in the world, an average of 422 Kgs of CO2 were emitted. [Note 2] The amount of CO2 emitted for each £1000 spent is called the emissions intensity of production.
A rise in emissions intensity of 1% means that goods will be produced with 1% more emissions. Also a 1% rise in production creates 1% more emissions. When both change the % change in emissions is given by
% change in production + % change in emissions intensity
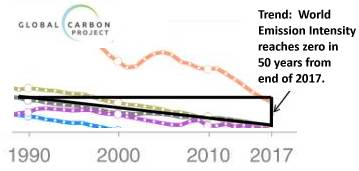
The global trend in emissions intensity has been -2.0% of its 2017 value. This rate of fall (-2.0% is a fall) has been fairly steadily for 30 years or so. At this rate it would reach zero in 50 years.
If the rate of producing goods for consumption did not change, greenhouse gas emissions would fall at the same rate as emissions intensity and CO2 emissions become zero in 2067. Global CO2 emissions are now over 40 billion tonnes per year. If these emissions were actually to decline at the 2% a year rate, the total emissions would be over 1000 billion tonnes of CO2. [Note 4]
A trend in emissions intensity of -2% means that the trend in CO2 emissions is 2% less than the economic growth rate. (Here, the rate of economic growth is taken to be the same as the rate of change of production.) [Note 5]
Remaining carbon budget
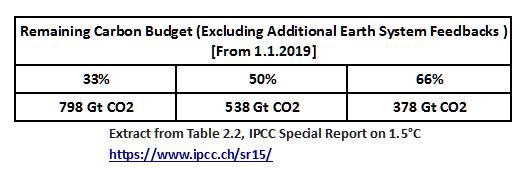
The remaining carbon budget is the amount of CO2 [Note 6] that can be put into the atmosphere before the Earth is set to have a rise in temperature of a given amount. Usually this is estimated for a rise in global temperature of 1.5°C or 2°C above the average for years 1850-1900. In the IPCC Special Report on 1.5°C (SP15), Table 2.2 gives estimates of the remaining carbon budget for keeping below 1.5°C. Here is an extract of Table 2.2, updated for the start of 2019 [Note 7]:

Because climate science is not exact, the report takes gives three estimates of the remaining carbon budget with probabilities of their being correct. These are three estimates of remaining carbon budgets for keeping within the 1.5°C limit. Budgets for probabilities 33%, 50% and 66% were estimated.
The middle figure in the table above means that to have a 50% chance of keeping below a 1.5°C rise in global temperature, global emissions should be less than 538 Gt CO2 from the beginning of 2019. [Note 8]
Required decline in emissions
According to the Global Carbon Budget 2018, global CO2 emissions for 2018 were 42.2 billion tonnes of CO2. This would exhaust the 50% chance, 1.5°C carbon budget in 13 years. [Note 9] To keep within this budget with a steady (i.e. linear) fall in emissions, it would be necessary for emissions to fall by 1.65 Gt CO2 per year, 3.9% of current emissions. This would reach zero emissions in 2044.
If emissions intensity is falling at a rate of 2.0% of its 2017 value (see above), keeping CO2 emissions falling at 3.9% a year means economic growth must be less than -1.9% (2.0%-3.9%). The world economy must shrink by 1.9% a year. [Note 10]
This is degrowth.
To save us from climate disaster degrowth is required.
Who pollutes most?
One answer to this question is given by an infographic from Oxfam:
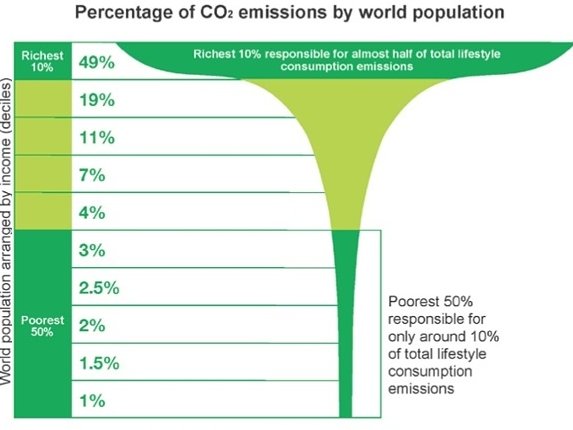
The general gist of the infographic should not surprise: The rich spend more, consume more and have more produced for them. Consequently they are the cause of more greenhouse gas emissions. What may be a surprise is the size of the difference between rich and poor. The most affluent 10% of the world population cause nearly half of the emissions but the poorest half of the world cause only 10% of the emissions.
To cut emissions in a substantial way, it is clear that emissions from the rich must be lowered substantially. This means cutting their consumption. Worldwide, the rich must be worse off, until the time when the intensity of emission can be substantially lowered – as the prominent climate activist Greta Thunberg has noted.
Notes
In Appendix: Worries on climate science, I worry that the result that the world economy must shrink by 1.9% a year is an underestimate and the affluent must cut their consumption substantially.
Part 2 will discuss the policy of ‘inclusive growth’ promoted by the Joseph Rowntree Foundation and their approach to climate change.
Note 1
For every £1000 spent, Mike Berners-Lee gives a figure of 720 Kgs of carbon dioxide equivalent (CO2e). CO2e includes the effects of other greenhouse gasses which add to global warming. I have used an estimate which is 84.4% of Mike Berners-Lee’s figure to reduce it to CO2 alone. (See Greenhouse gas emissions: 2013 from the Office of National Statistics.)
Note 2
The Global Carbon Budget 2018 gives the carbon intensity of production as 0.320 kgs CO2/USD (See graph Top emitters: Fossil CO2 Emission Intensity). A conversion rate of 1.32 USD to 1 GBP is used to give 422 kgs CO2 per £1000.
Note 3
The date of 2067 has been estimated from the graph Top emitters: Fossil CO2 Emission Intensity in The Global Carbon Budget 2018. This is an annotated version
Note 4
According to the Global Carbon Budget 2018, global CO2 emissions for 2018 were 42.2 billion tonnes of CO2 (i.e. 42.2 Gt CO2 with 37.1 Gt CO2 from fossil fuels and 5.1 Gt CO2 from Land Use Change). If these fell steadily to zero over 49 years from the end of 2018, emissions would be 1033 Gt CO2.
Note 5
In this article I will assume that spending, consumption and production are being equal. Not strictly correct but good enough for the argument here.
Note 6
Other greenhouse gasses, such as methane and nitrous oxide, are often assumed to be in a proportional relation with CO2 so may be treated separately. See Note 1 above.
Note 7
I have deducted 42 Gt CO2 from the figures and updated the date to 1.1.2019
Note 8
Table 2.2 mentions “additional earth system feedbacks” such as carbon emissions from melting tundra. If these are taken into account the remaining carbon budget for the 50% chance of keeping below 1.5C in 13 years reduces to 438 Gt CO2.
Note 9
The Mercator Carbon Clock has a figure of less than 9 years to reach the 1.5C limit. They have used the remaining carbon budget for a 66% probability of keeping within this limit. I used the limit for 50% probability giving a larger estimate of 13 years. Here is the Table 2.2 extract again.
Note 10
To have a fall in emissions of 3.9% when the trend of emissions intensity is -2.0% a year, the economy (i.e. the amount produced) must shrink by 1.9% each year. i.e. 3.9% – 2.0%
The percentage rates here are given with respect to the values in 2017.
Appendix: Worries on climate science
In this article I have used the middle value in SP15 Table 2.2 for the remaining carbon budget for a 1.5°C rise in temperature – the value designated as a 50% chance. In addition, I have not deducted the 100 Gt CO2 predicted for the emissions from melting permafrost. This means the required degrowth of 1.9% may be considered an underestimate.
I have followed climate science for a few decades now and had the opportunity of meeting and corresponding with climate scientists, related experts, politicians and government officials.
I have become aware of the gap between politics and the physics of climate change. In general, there are political pressures to downplay the dangers of climate change.
With UK government departments, I have found a reluctance to confront climate issues on topics like climate feedbacks, the carbon footprint of cattle and embodied carbon in buildings. Although the differences between the different methods of reporting UK’s carbon emissions are quite well known, it is disappointing to see the Department of Business, Energy and Industrial Strategy strongly promoting the measure that ignores the embodied carbon in imports. Basically UK Government downplays climate change.
Political influence has sometimes affected the Intergovernmental Panel on Climate Change: A key word is ‘Intergovernmental’. For an authoritative view of the Special Report on 1.5°C see the article on Real Climate by Gavin Schmidt, the Director of the NASA Goddard Institute for Space Studies. He politely references the issue of politics and climate:
Can we avoid going through 1.5ºC?
IPCC has to use a few circumlocutions to avoid giving a direct answer to this question (for reasonable and understandable reasons). I’m not quite so constrained…
He also says
The basic issue is that the effort to reduce emissions sufficiently to never get past 1.5ºC would require a global effort to decarbonize starting immediately that would dwarf current efforts or pledges. This seems unlikely (IMO).
To his question ‘Can we avoid going through 1.5°C he says:
So my answer is… no.
He paraphrases Eliud Kipchoge, the recent winner of the Berlin marathon:
The best time to start [reducing emissions] was 25 years ago. The second best time is today.
Gavin Schmidt is one of the most respected climate scientists in the world. His comments should mean that the estimates above for a degrowth rate of 1.9% may be rather too small. To achieve this the world’s affluent must cut their consumption substantially.
TrackBack URL :