Debugging Unity Players over network and USB with Rider 2020.2

Rider 2020.2 is a bumper release for Unity. We’ve already seen how “pausepoints” can help you debug your code, by switching the Unity editor into pause mode when your code hits a certain point. Let’s continue looking at how Rider can help with your Unity application.
We’ll stick with debugging for now, and in this post we’ll see how you can use Rider to debug your game on mobile devices and consoles such as iPhone, Android, Xbox and PlayStation.
We’ll follow up with another post looking at how Rider improves the default display of values while debugging, and then we’ll have a couple more posts detailing Rider’s Burst analysis, and then take a dive into, wait for it, shader support!
Rider has always supported debugging players, such as standalone desktop apps, mobile devices and consoles, but this release sees a number of new features, a bit of polish and a couple of bug fixes to make it even better. It also introduces USB debugging for Apple devices.
Player discovery
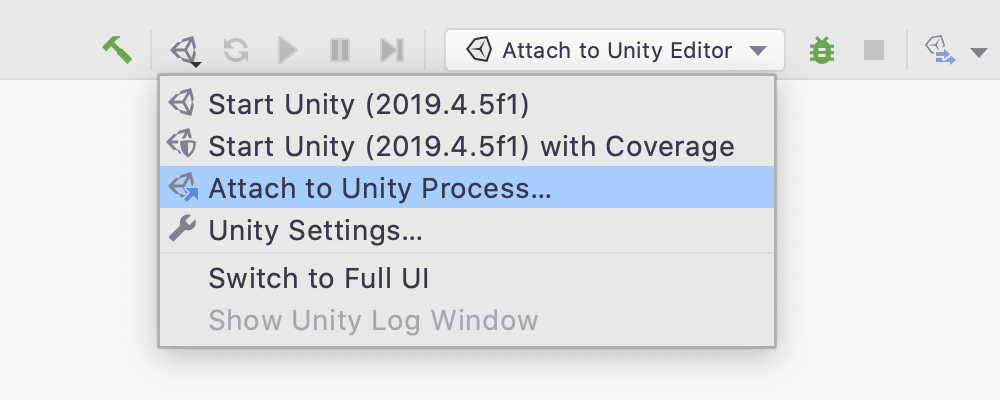
It’s nice and easy to start debugging a player, simply use the Attach to Unity Process action, available in the Run menu, or in the drop down menu when you click the Unity logo in the main toolbar.
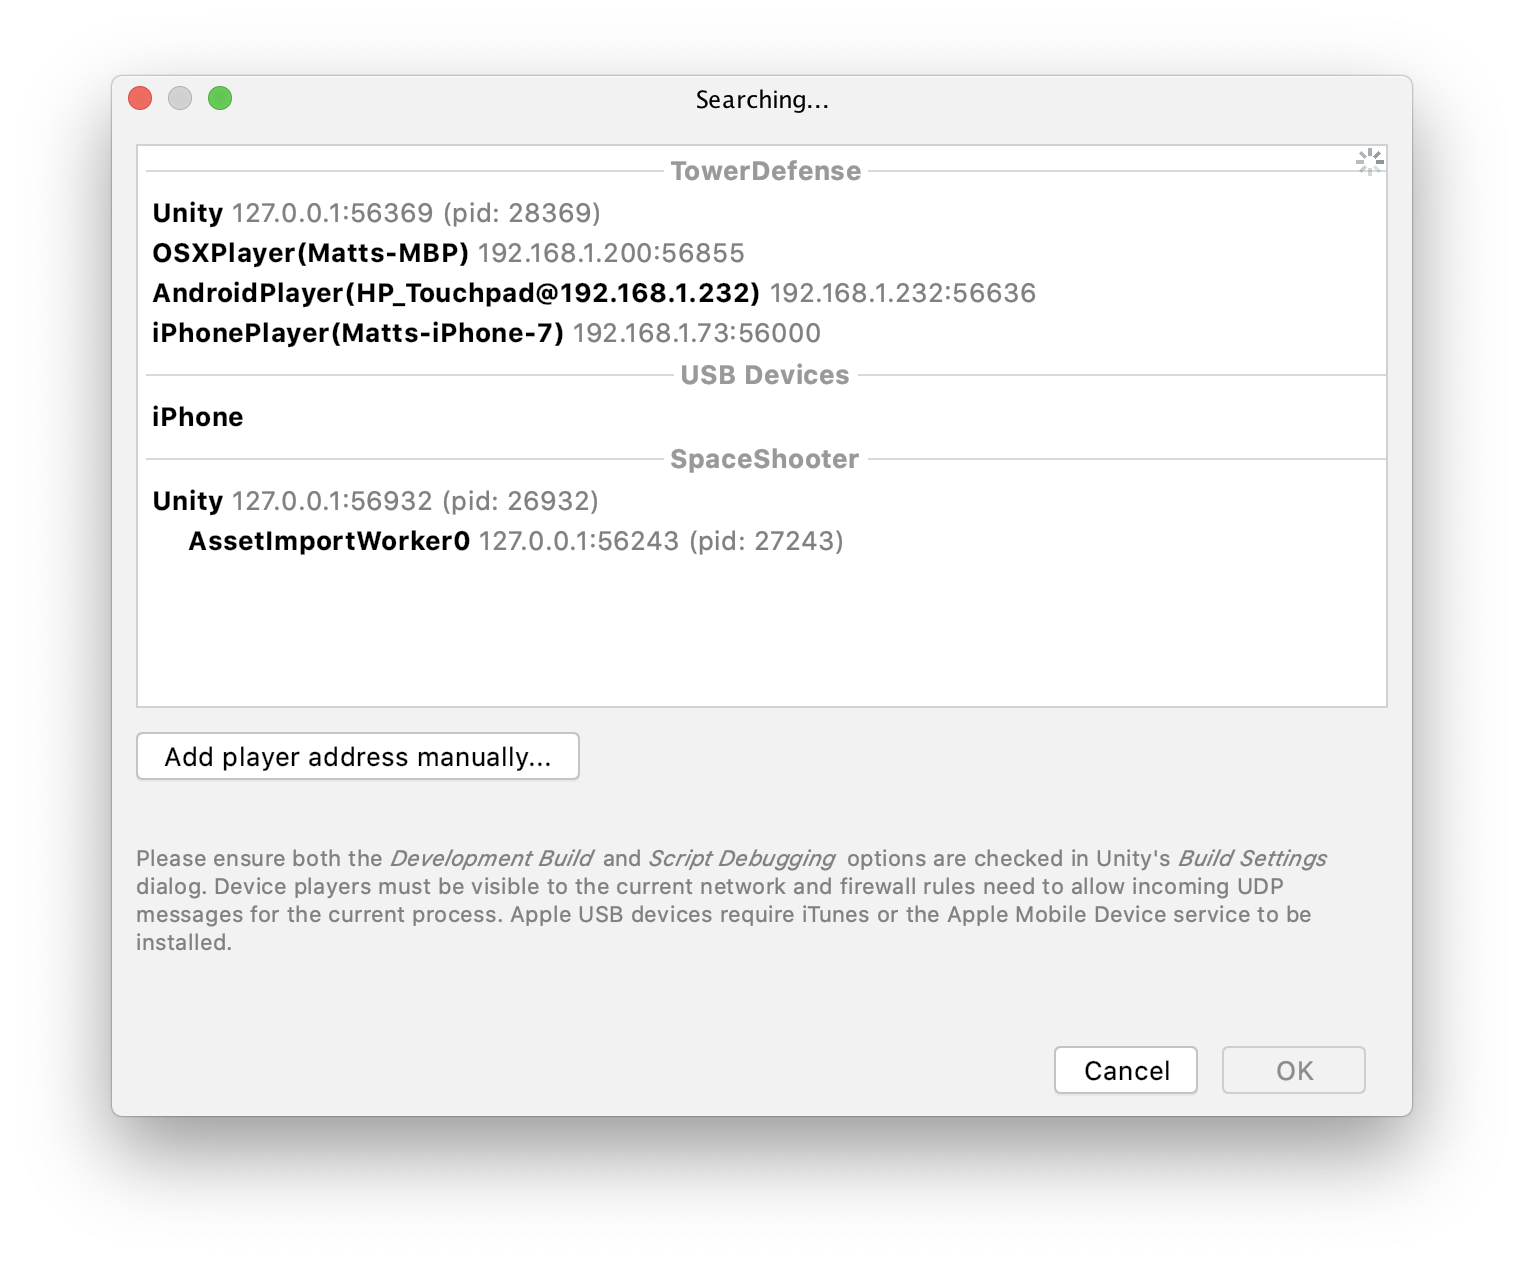
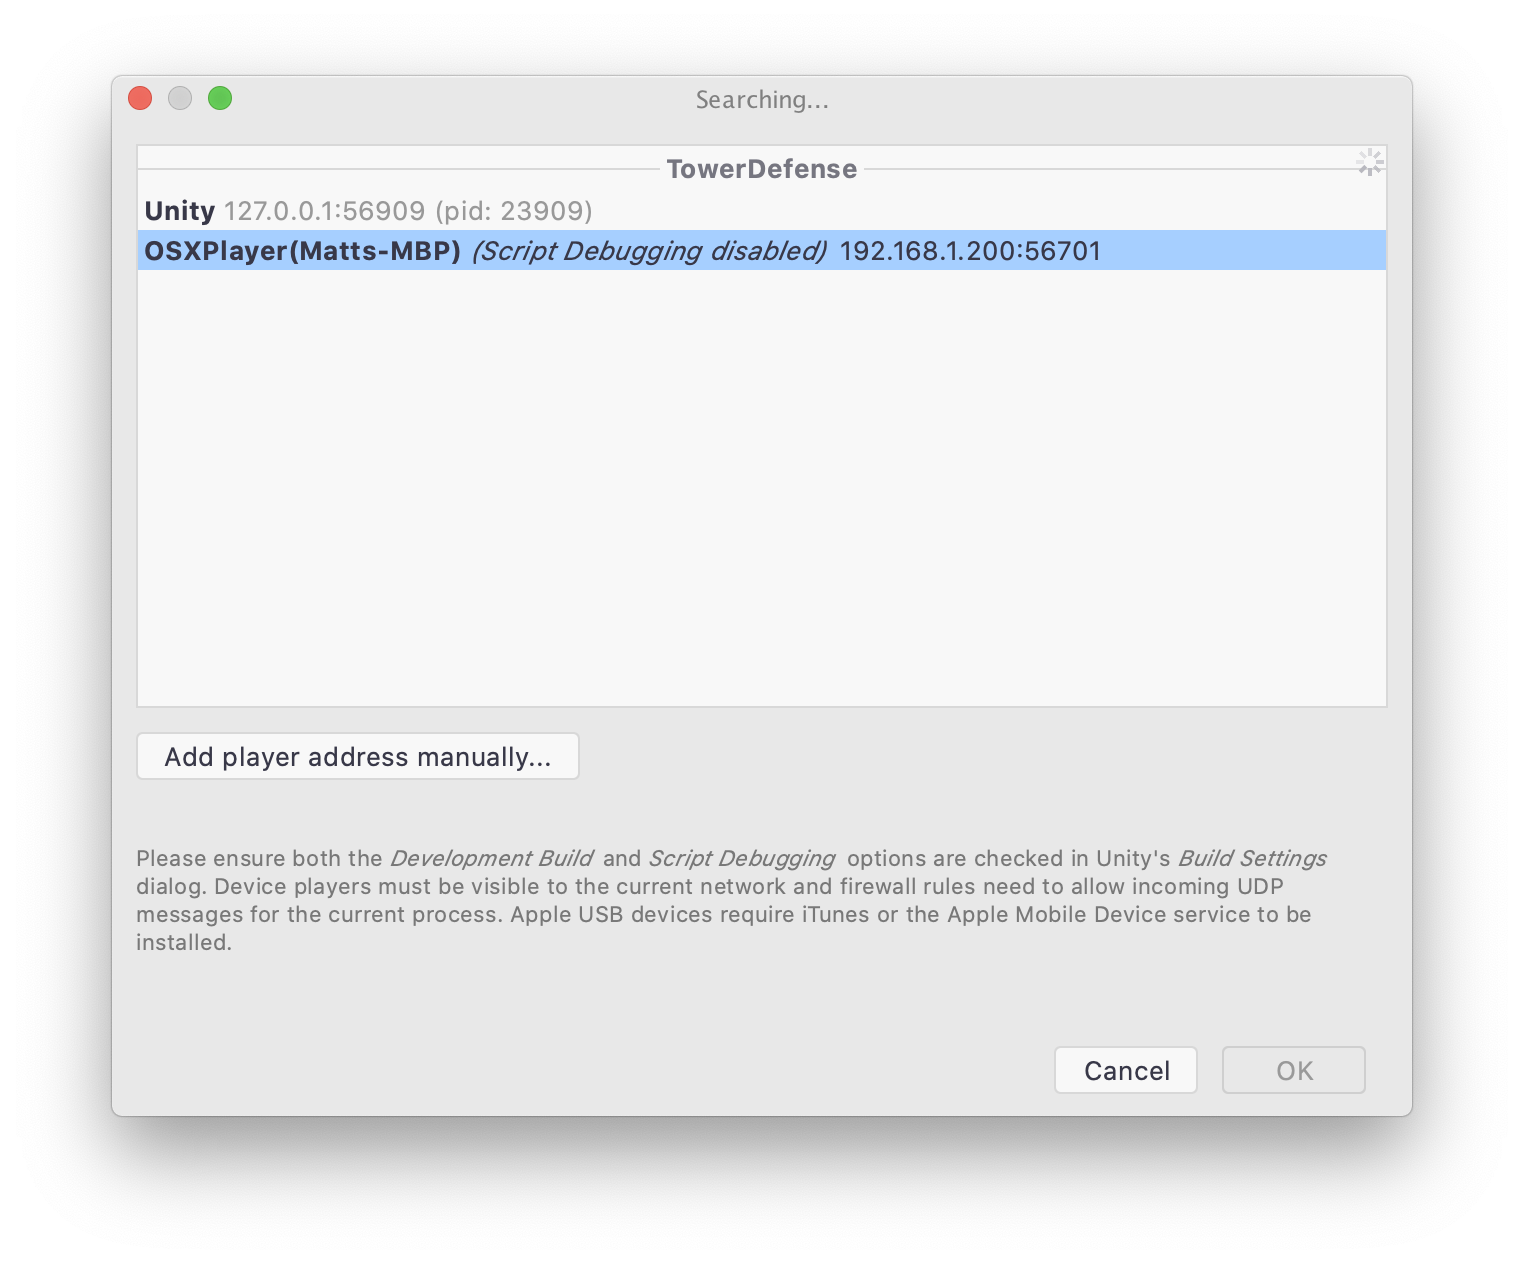
This will open the Attach to Unity Process dialog, which lists the available processes to debug. This dialog has had a little polish in this release, and now groups the players by project, with the currently open project at the top of the list.
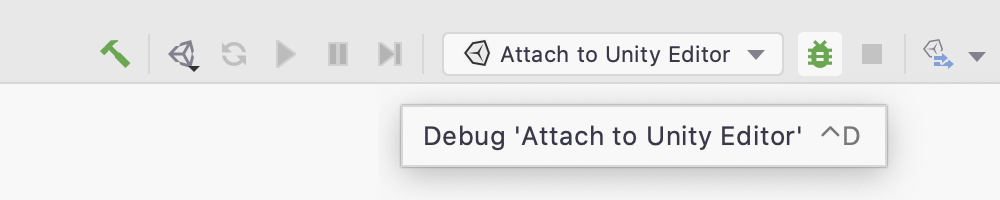
Looking back at the screenshot of the dialog, you can see that there can be quite a few different processes listed. Let’s take a look at what Rider is going to show you. Rider will list all editor processes, grouped by project when possible, with the current project shown at the top of the list. You can attach the debugger to the editor from this dialog, or you can use the Attach to Unity Editor run configuration and just click the Debug button in the main toolbar.
Rider will also list any helper processes created by the Unity editor, shown as a child of the main Unity editor process. This is useful for debugging features that Unity runs out of process, such as asset import workers for the new DOTS system.
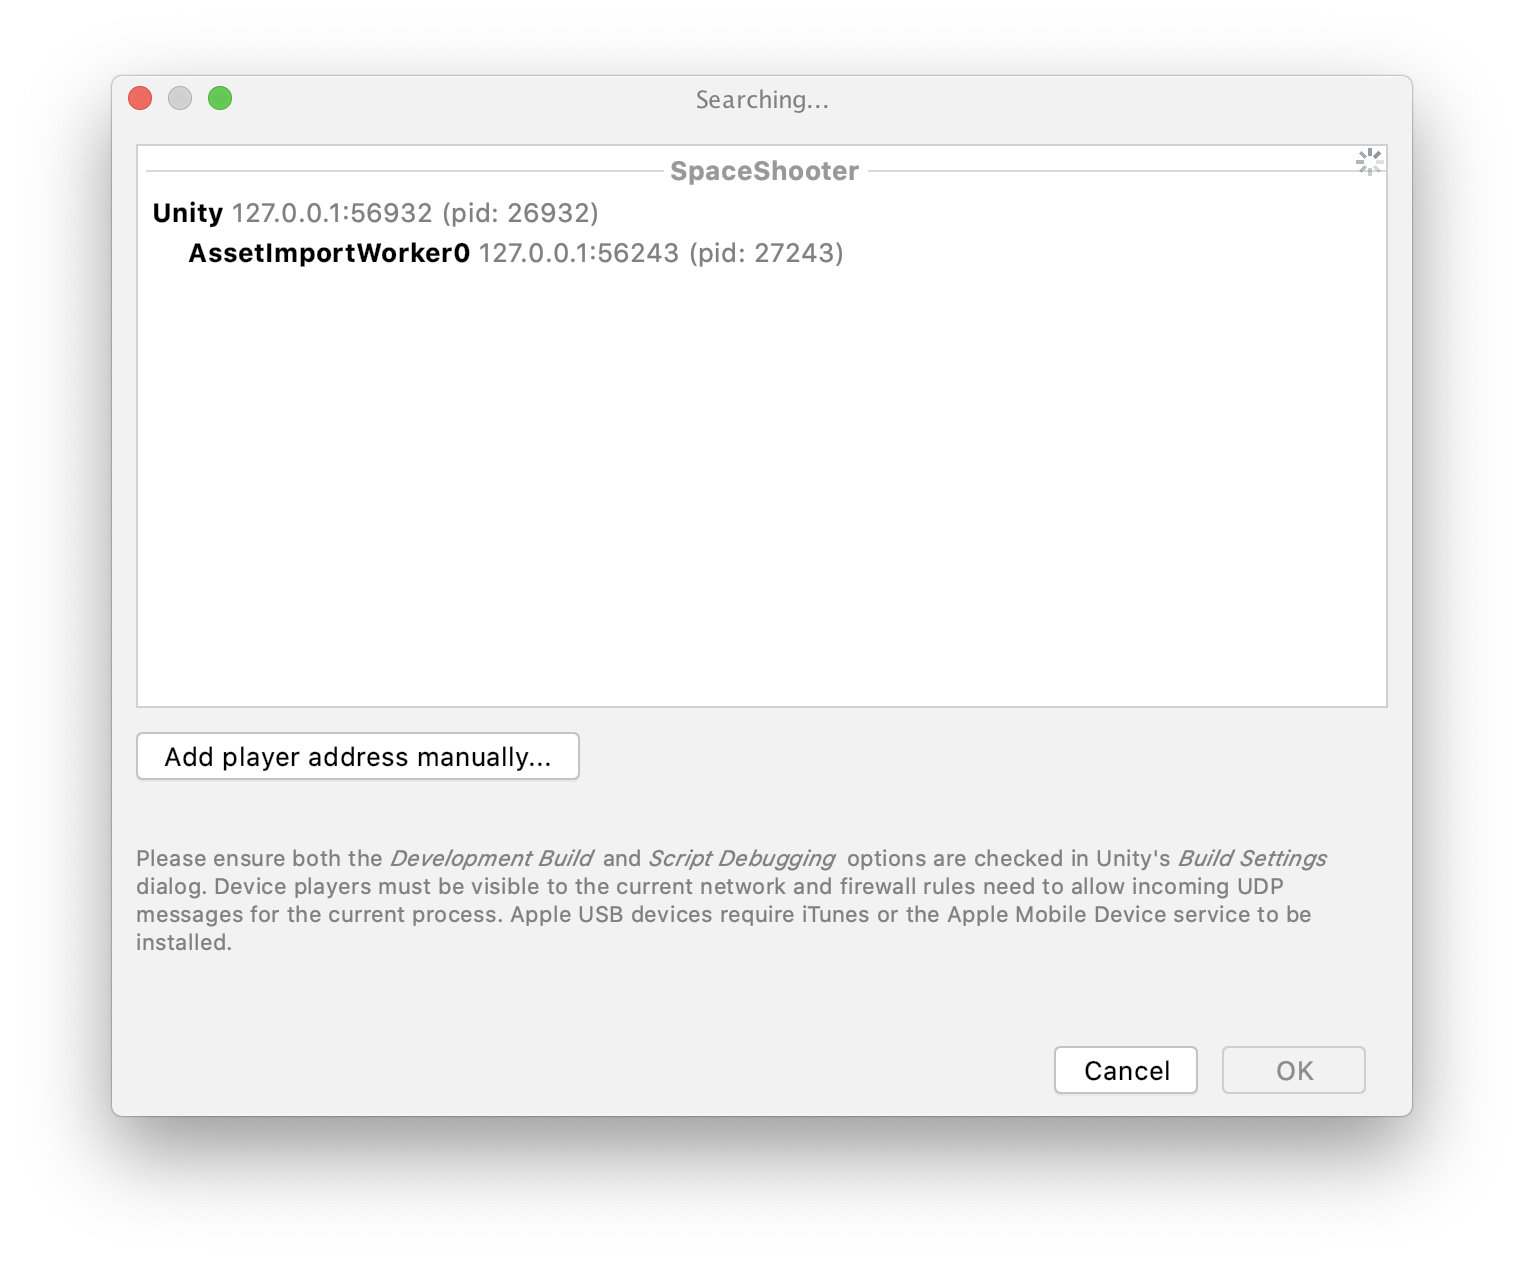
Rider will then list all other players for the current project. This includes standalone players such as the Windows or OSX player, followed by remote players, such as mobile devices or consoles.
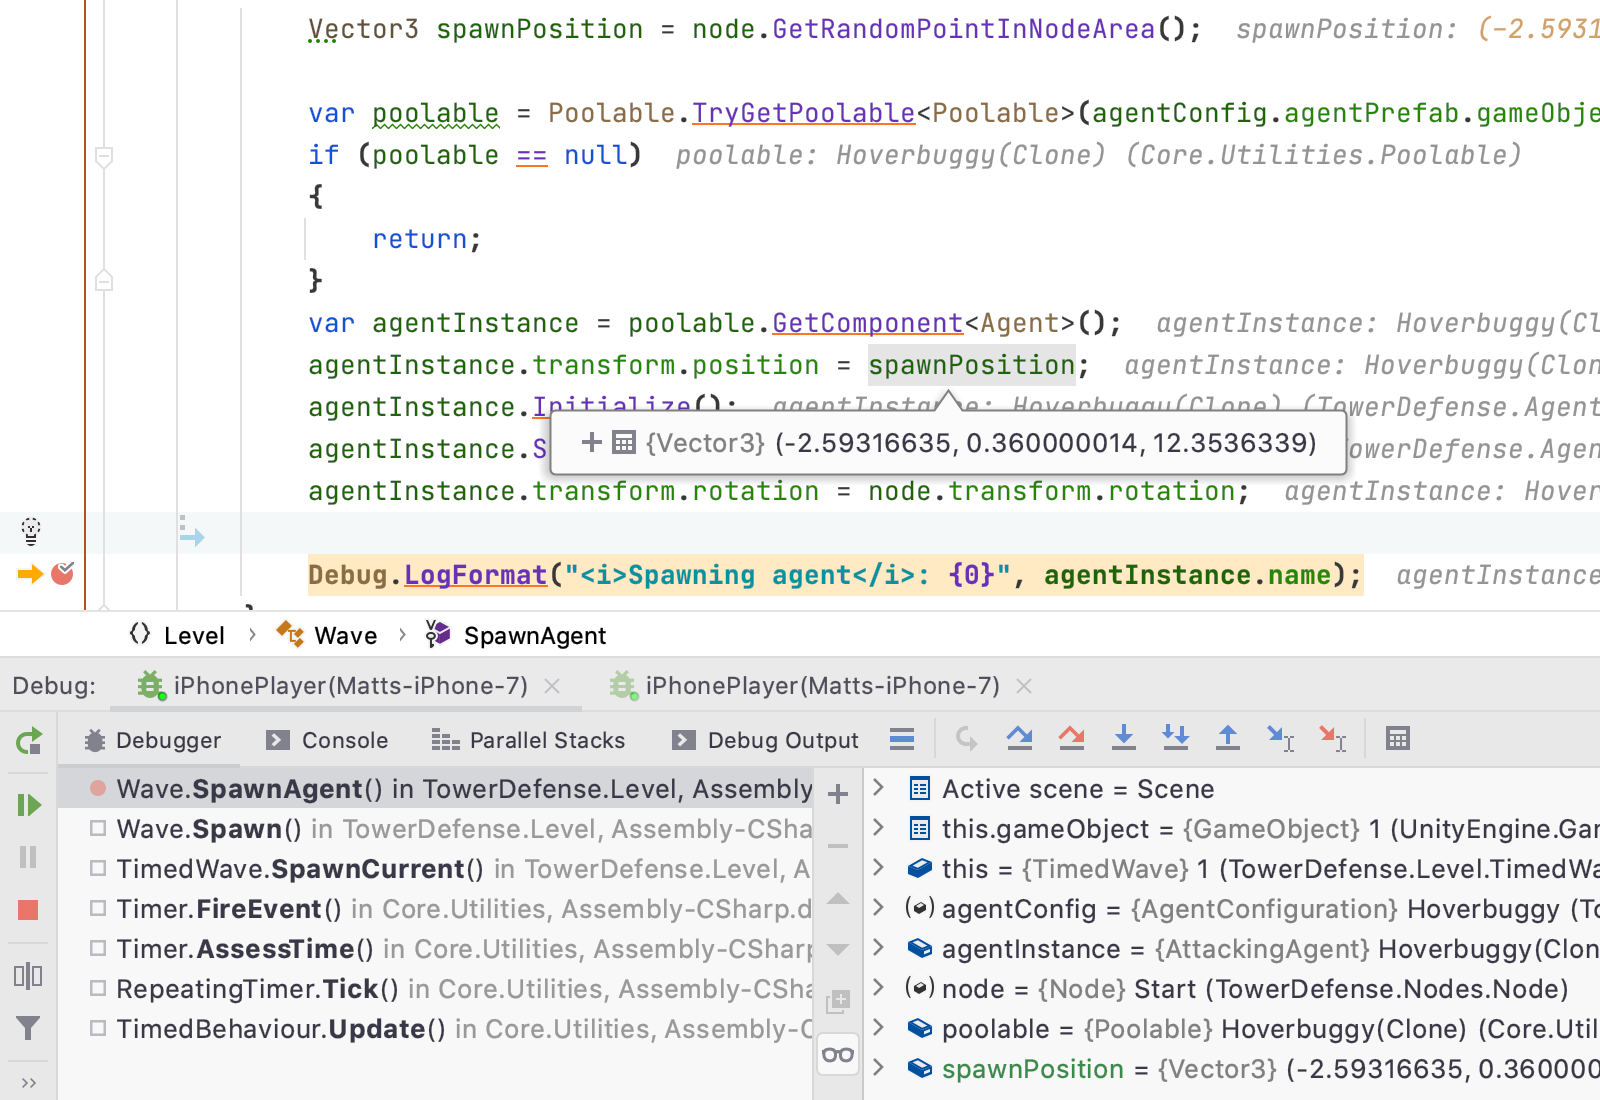
Selecting an item in the list and clicking OK will start the debugger (double-click the item if you’re in a hurry), and that’s it! You’re now debugging your game running on a device. Rider’s debugger features work just the same as if you’re debugging a local process – local variables, watch variables, evaluating expressions and calling methods and so on. And everything works great with cellular devices such as phones that can connect to the internet via WiFi or their own cellular radio.
Apple USB debugging
New to Rider 2020.2 is debugging of Apple devices over USB. You can now debug your iPhone or iPad game via network, or over a USB connection. This can be really useful if your device isn’t able to connect to the same network as your desktop, or if your local WiFi is being a little flaky, or simply as a preference.
It all works seamlessly – the connected iPhone or iPad is listed in the “USB Devices” group, and you can simply select or double click and you’ll start debugging, just the same as over the network.
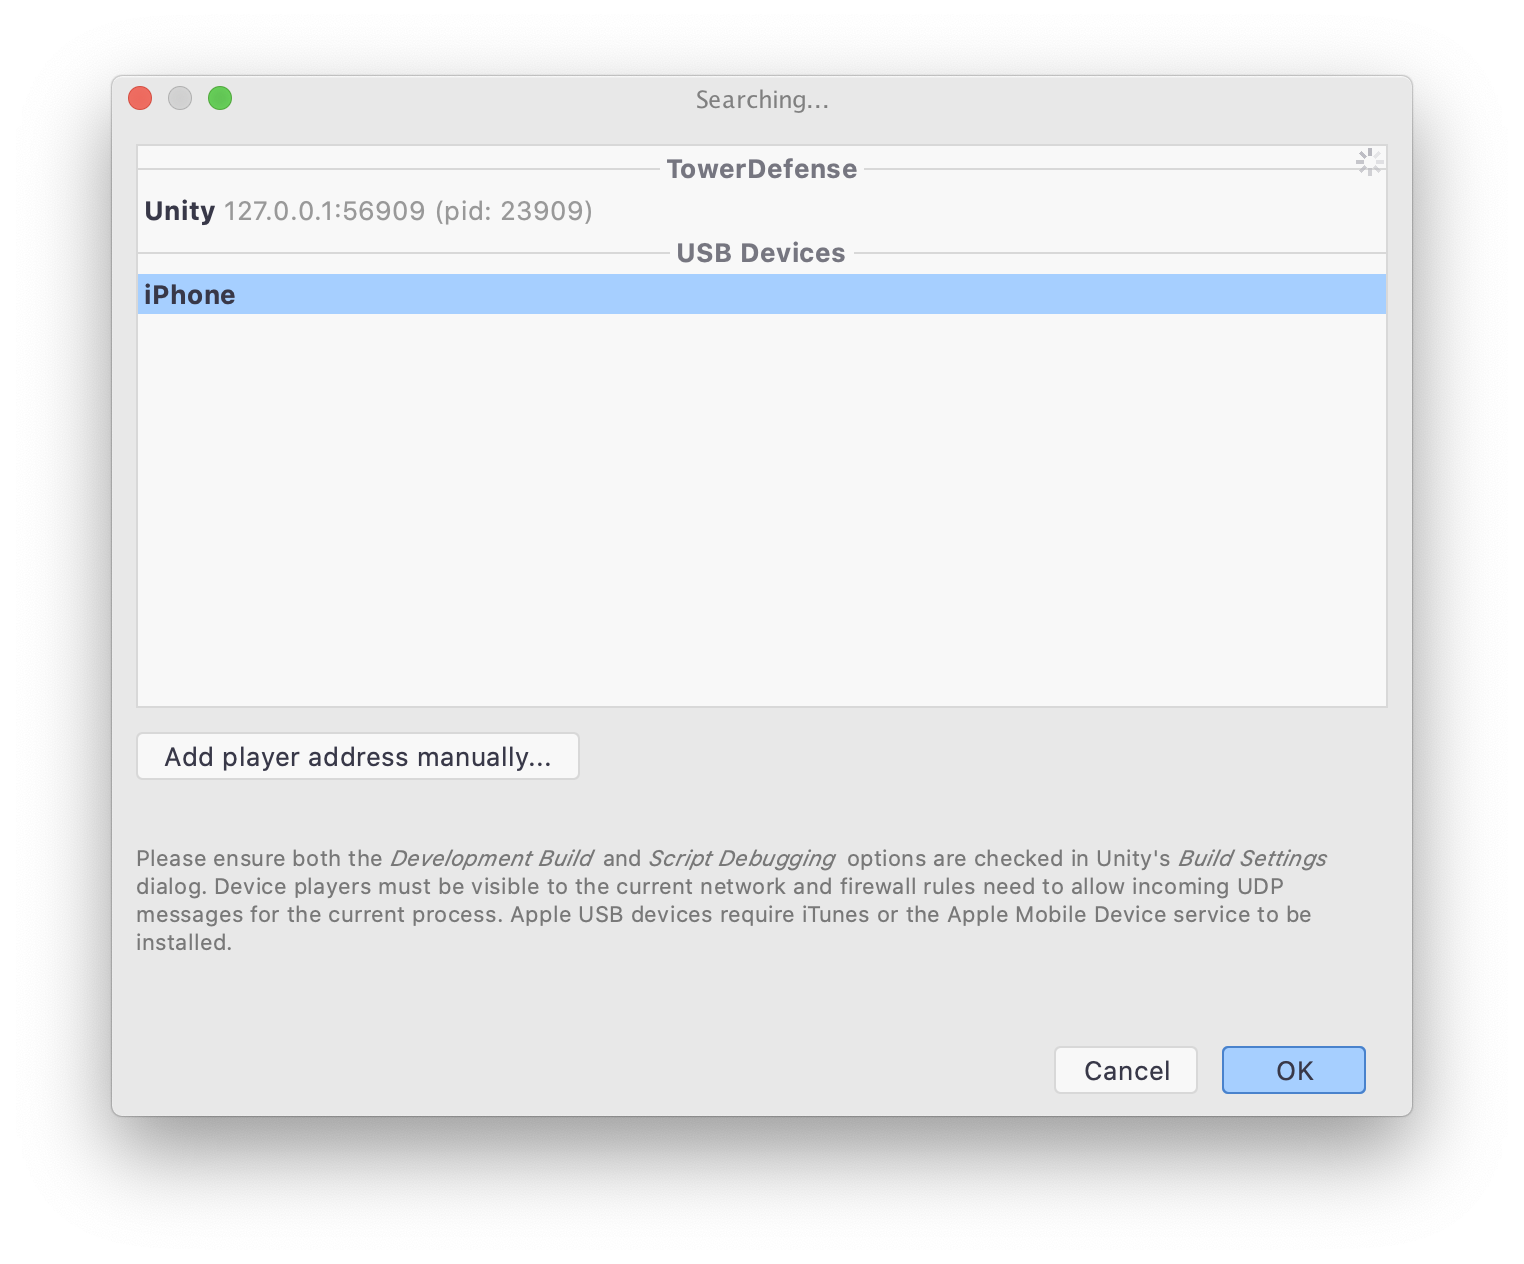
Rider doesn’t have much information about the connected device, so it’s lised simply as iPhone or iPad. And Rider also doesn’t know what’s running on the device, so you won’t get a project name, and in fact, you’ll see the device in the list even if your Unity game isn’t running!
The obvious question now is “what about Android?”. Rider doesn’t currently support USB debugging for Android, but you can still debug your Android game over the network. We’re planning on adding Android USB debugging in Rider 2020.3.
Manual player discovery
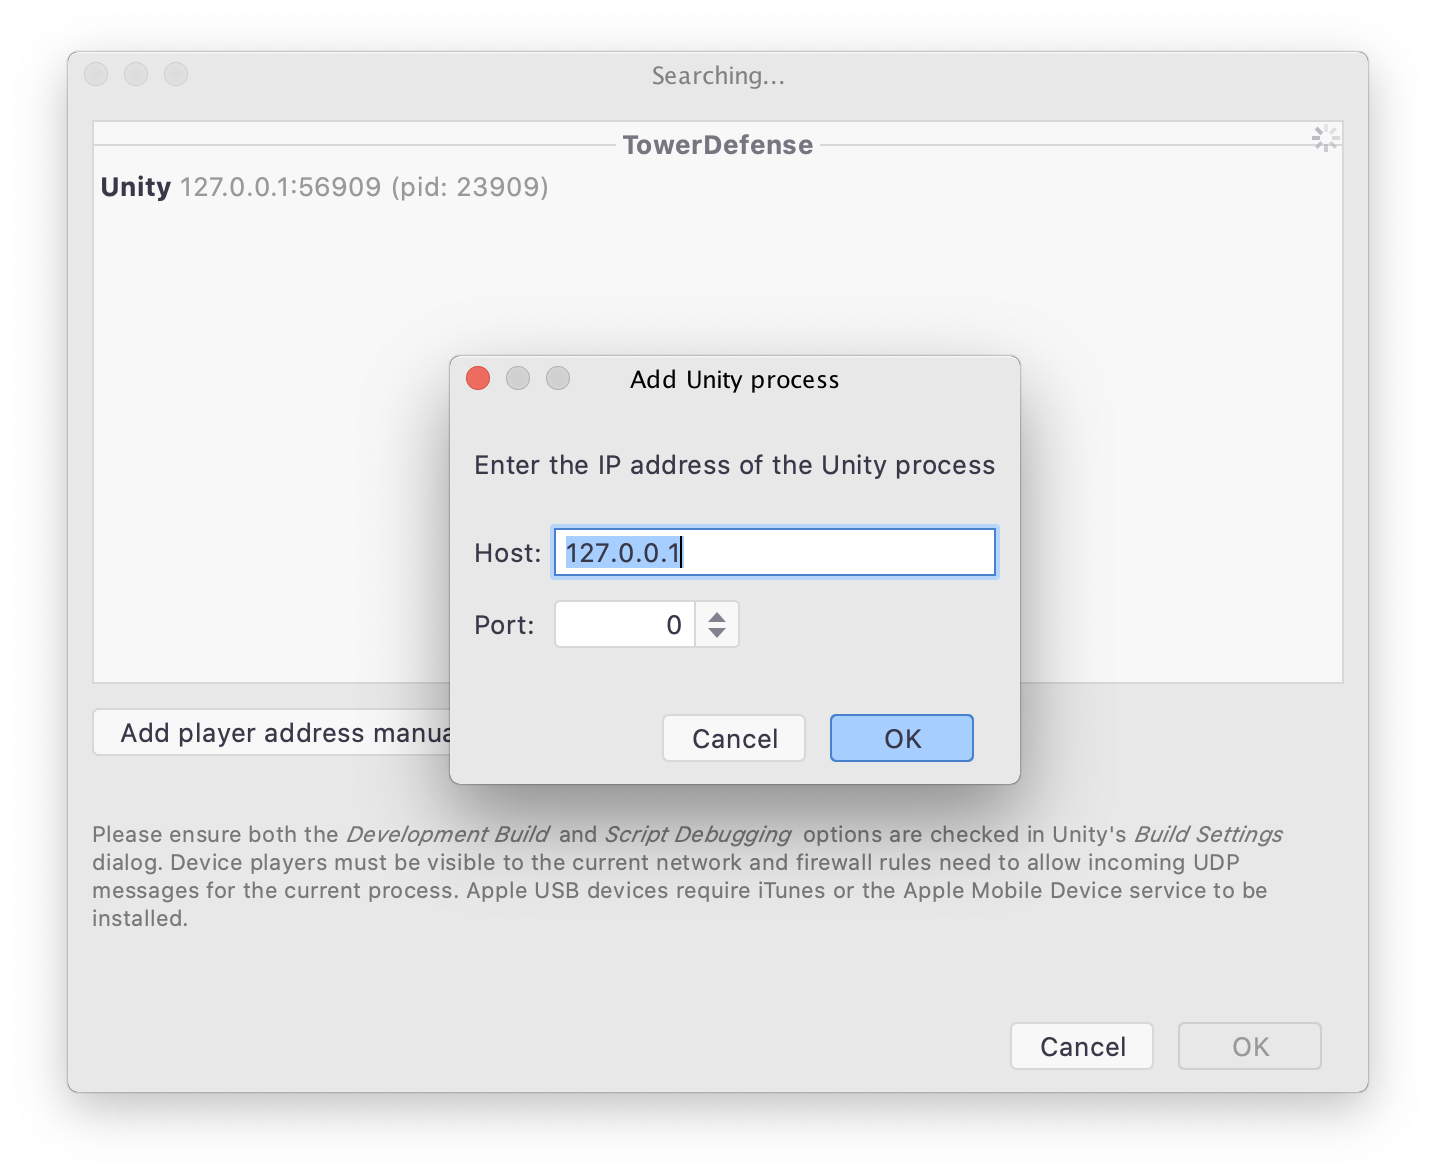
If for some reason the player doesn’t show up in the list, and you can find the device IP and port number from the player logs, you can use the Add player address manually button to enter the custom network details and connect the debugger manually.
Debugging and profiling standalone players
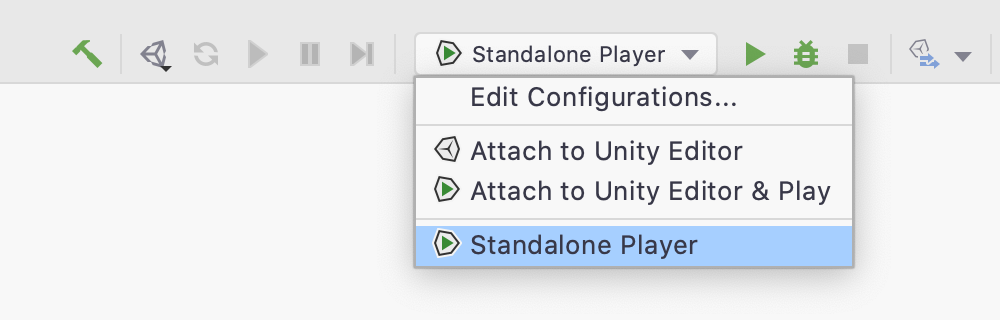
One other thing that Rider 2020.2 will do is to create a new run configuration when you build a standalone player. Rider’s plugin for the Unity editor will spot that a standalone player, for Windows, Mac or Linux, has been created, and will automatically create a run configuration called simply “Standalone Player”.
Once the run configuration is selected, the Run button will launch the desktop player. The Debug button will launch the process and attach the debugger. And you can even use the Profile button to launch the process and attach the timeline profiler to get a code focused profile of your standalone player.
You can find out more about profiling Unity executables in this blog post from Rider 2019.1 when we first introduced the feature.
Requirements
Now for the small print!
On the whole, it’s very easy to build and debug players from your Unity project, but there are a couple of required steps to make sure things work smoothly. You can read the details in Unity’s documentation (see the Troubleshooting the debugger section), but the TL;DR is that firstly, the player build must have Script Debugging enabled. If it doesn’t, Rider will highlight this in the dialog, and you’ll be unable to attach to the player.
Secondly, you need to make sure that the remote device is visible to your desktop’s network, and that firewalls aren’t blocking any traffic. The players broadcast their debug details via UDP messages, and if there’s a firewall blocking this, the player won’t appear in the list.
Finally, the version of Unity that you use to build your player makes a difference, too. If your player is built with a Unity version earlier than 2019.3, then you won’t see a project name – only players built with Unity 2019.3 and above broadcast this information. Rider will still happily debug older players, but they will be grouped under “Unknown projects”.
And you’re not limited to the Mono backend either – Unity 2018.2 added support for debugging IL2CPP based players as a normal C# application, so Rider is able to debug Mono or IL2CPP players.
UPDATE: Check out this troubleshooting guide that can help if players aren’t showing up in the list. In particular, it has some very useful tips about working with the macOS firewalls – yes, there are two! And the one that can cause trouble isn’t the one in System Preferences.
Download Rider 2020.2!
As you can see, Rider makes it easy to debug your Unity game. It’s very easy to attach to the Unity editor from the main toolbar, and the Attach to Unity Process dialog lists Unity editors, helper processes, local standalone players, remote players on devices and consoles and even Apple devices attached by USB. You can even launch, debug and profile standalone players with a single click!
Next time, we’ll take a look how Rider 2020.2 improves the default display of locals and variables in the watch window.
Download Rider 2020.2 EAP today, and try it with your own game. We’d love to hear your feedback!
Subscribe to a monthly digest curated from the .NET Tools blog: